Bus Factor 1: The Areas That Orphan When One Person Leaves
Bus factor 1 means one resignation orphans an area. How to inventory every single-owner zone in your codebase from git history and fix the worst first.
Source: Avelino 20162 receipts in this article ↓
TL;DR: Bus factor 1 names the specific directories that orphan the day one specific person resigns. Research on 133 popular GitHub projects found 34% of them at a truck factor of exactly 1. The list is computable from git history in an afternoon: inventory the single-owner zones, rank them by blast radius, fix the top three. The alternative is discovering the list during an exit interview.
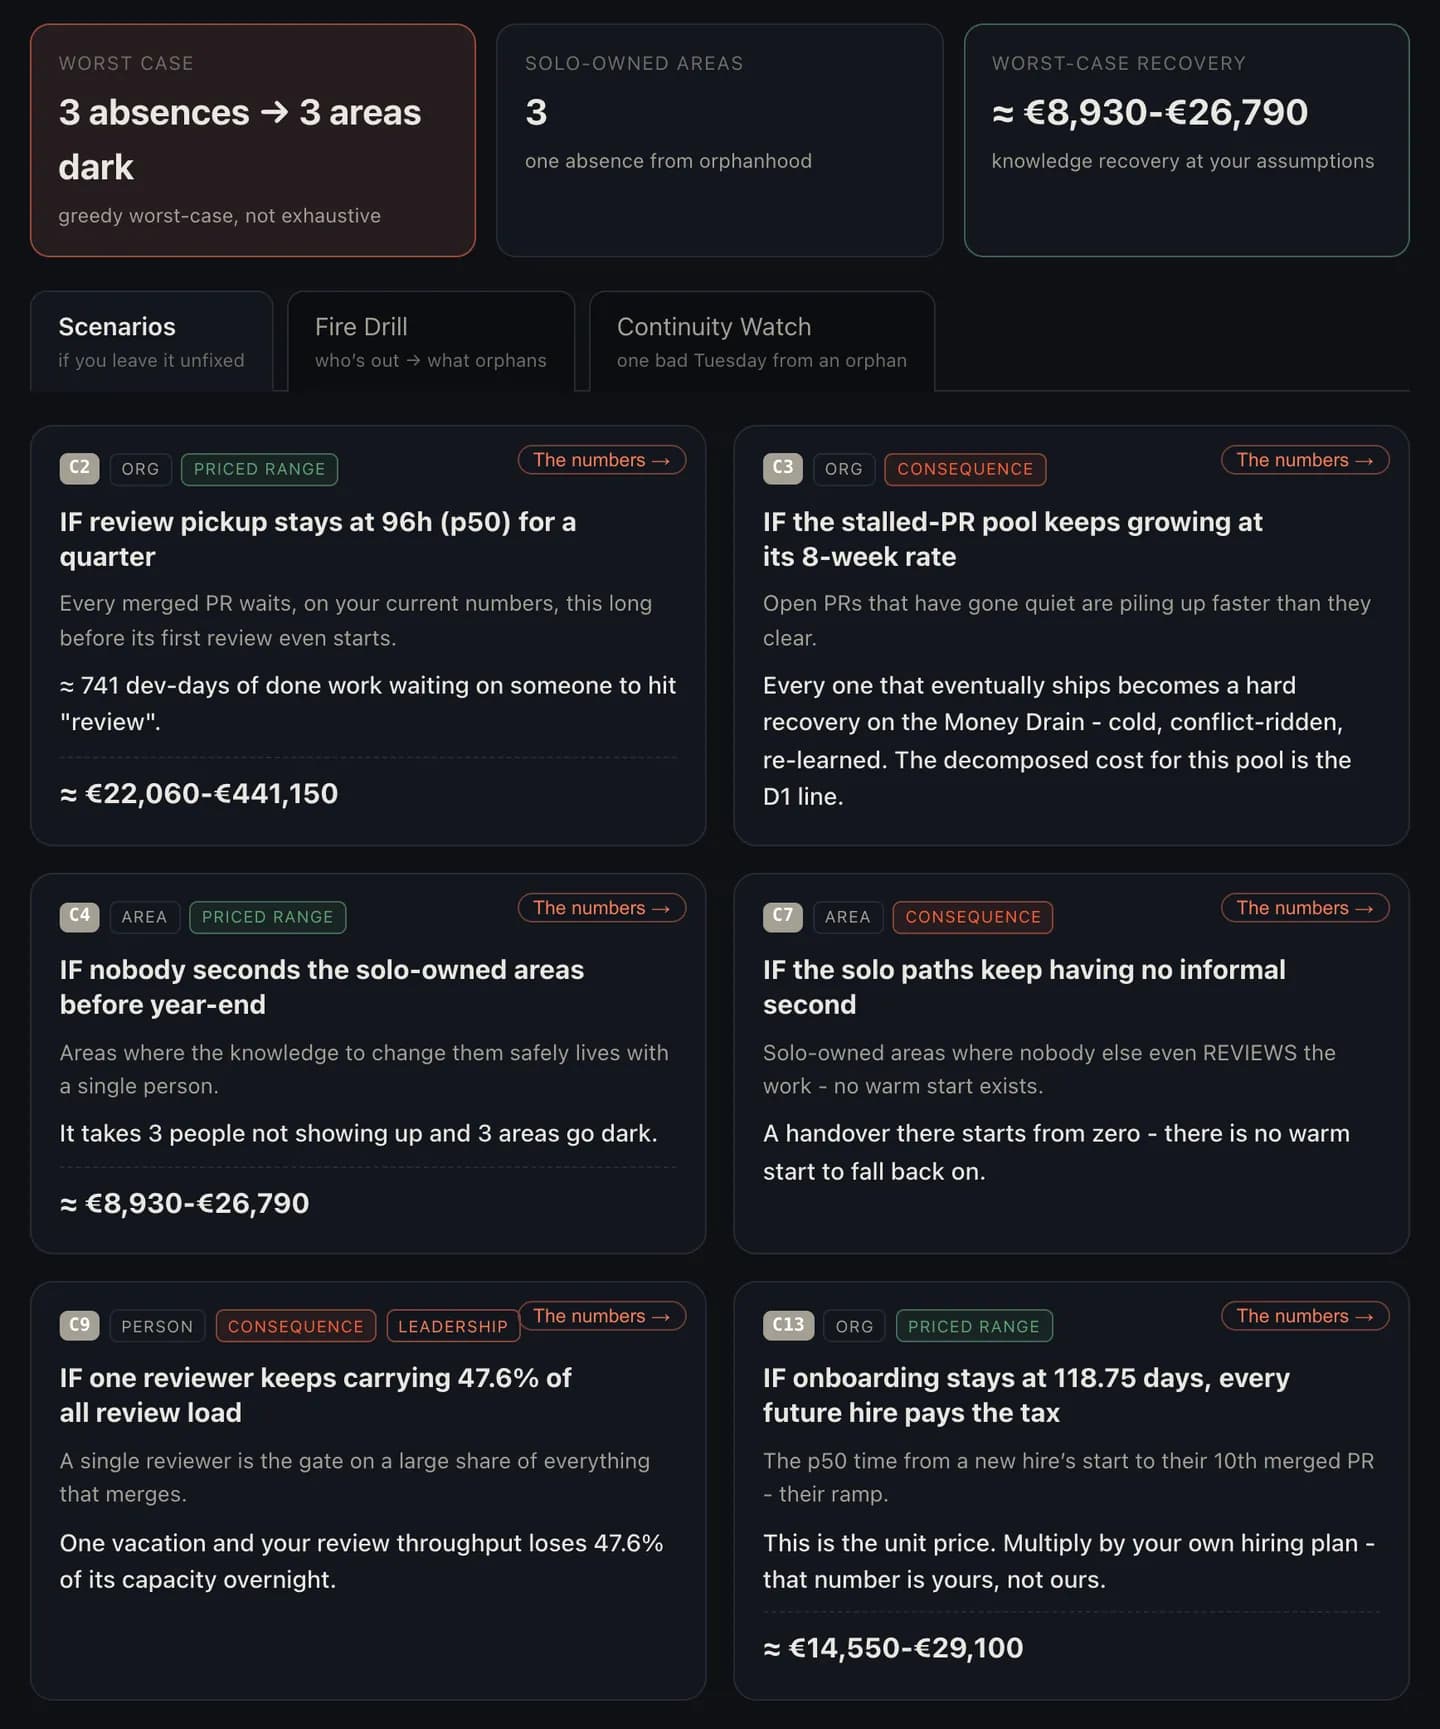
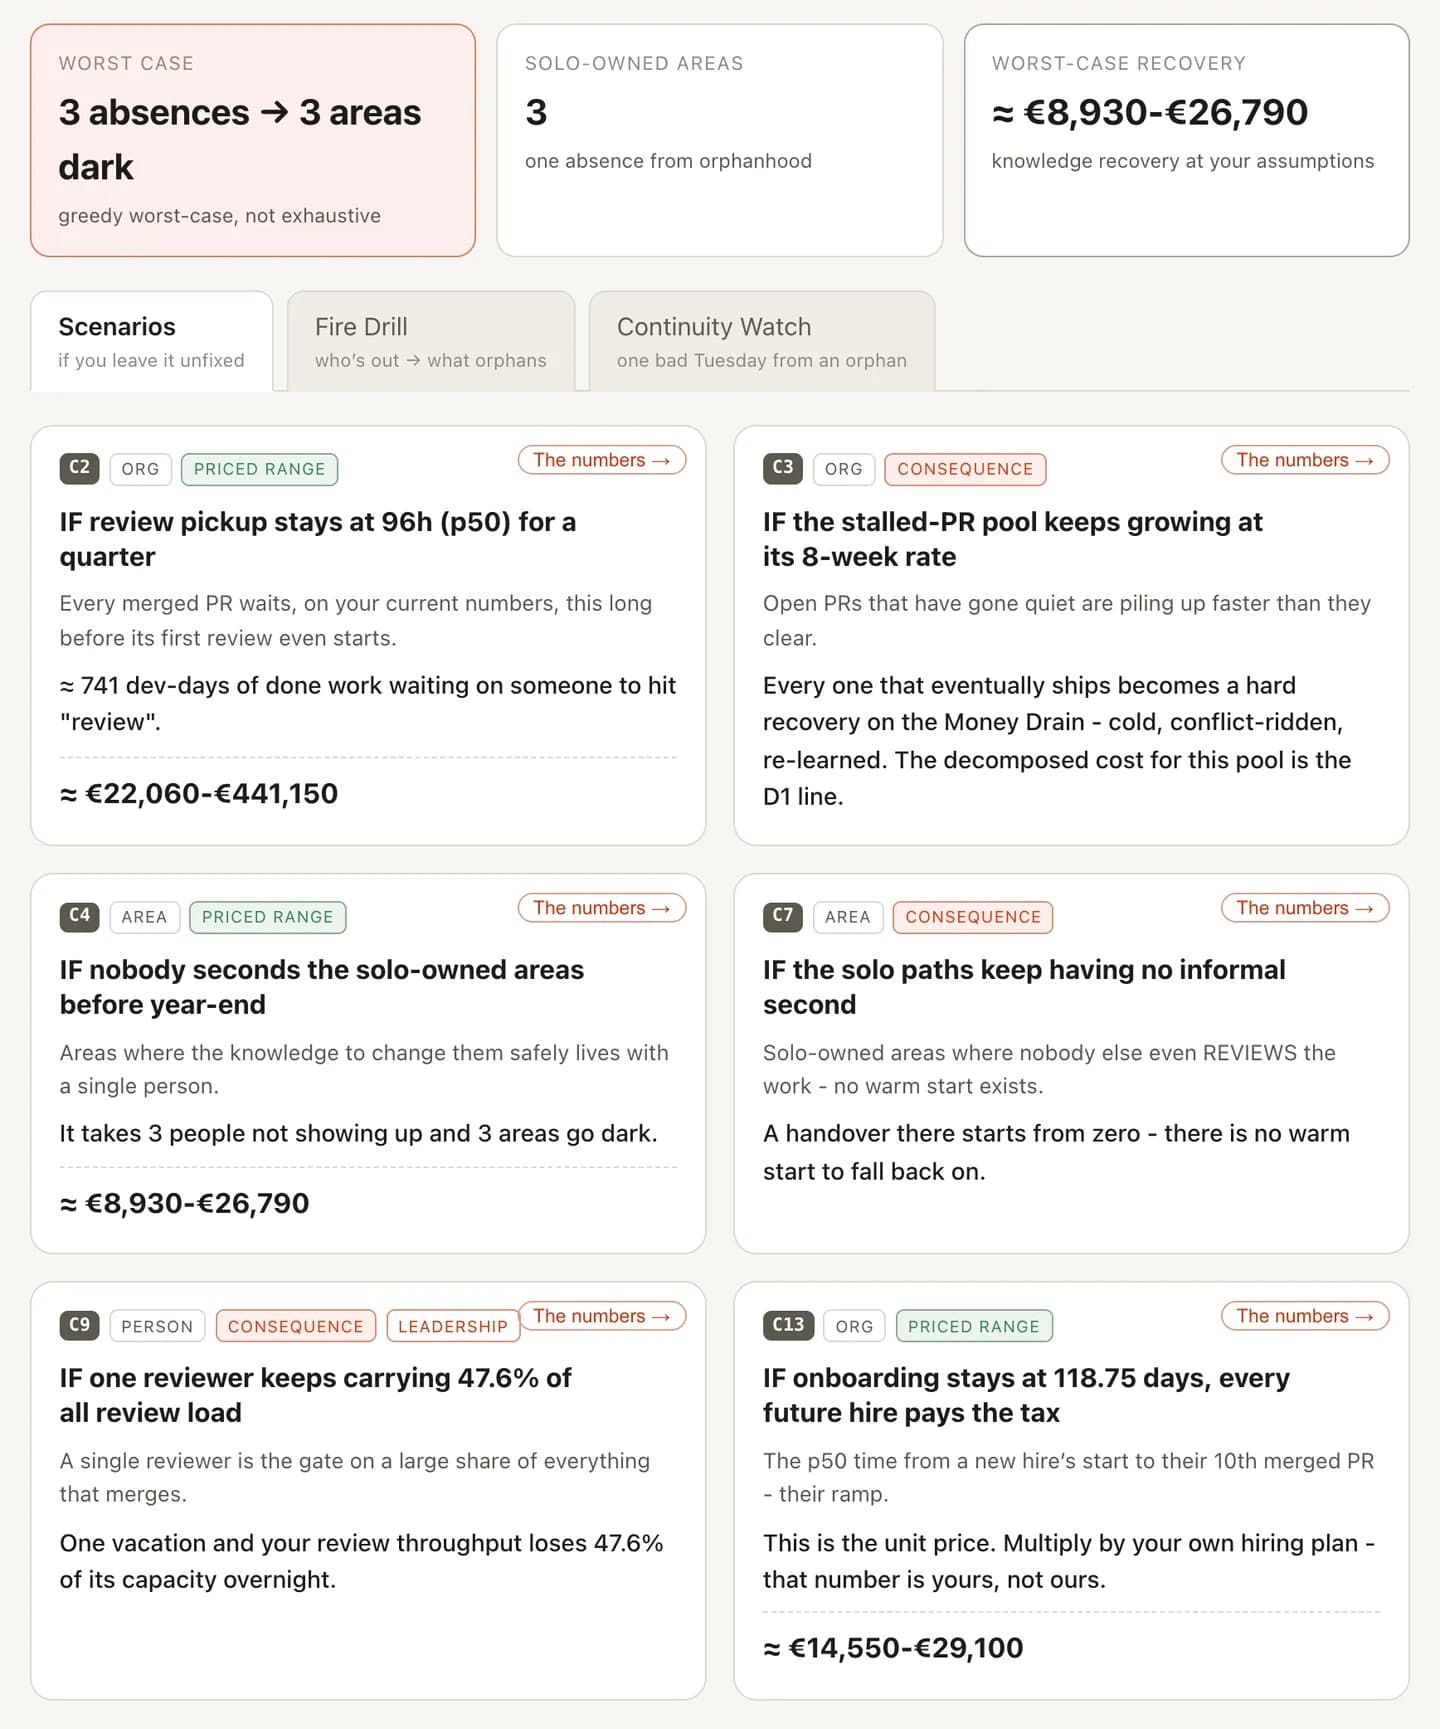
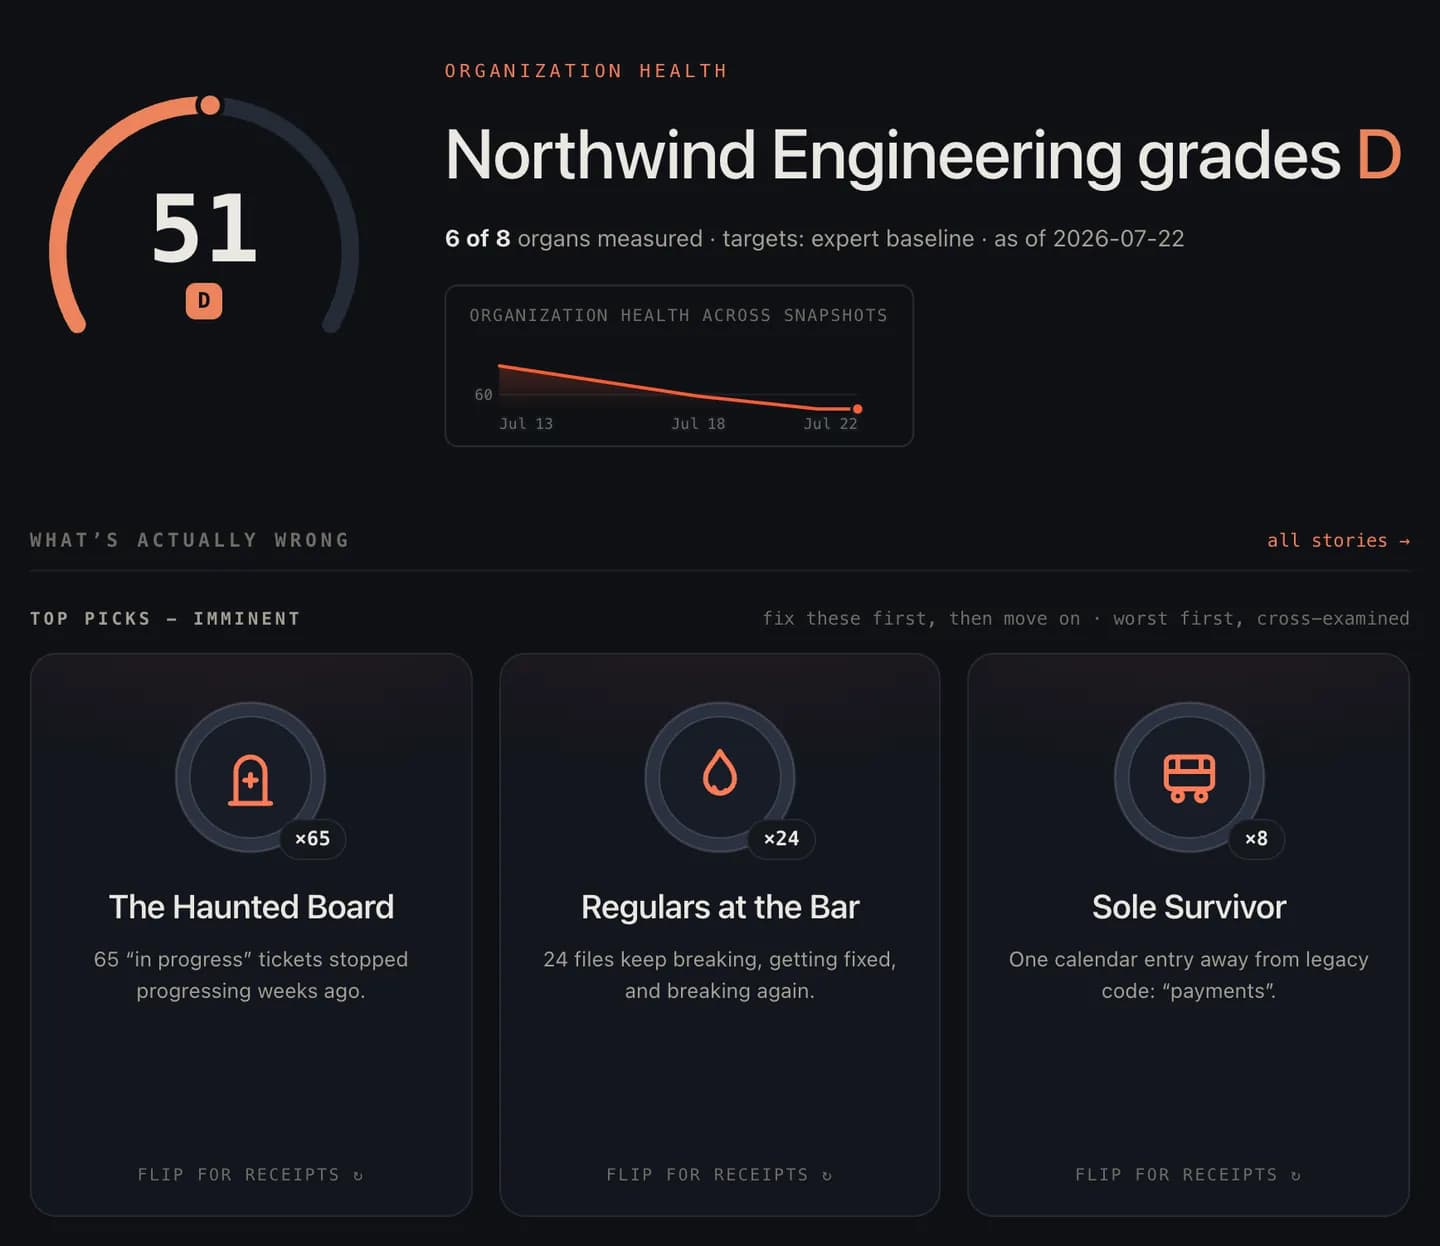
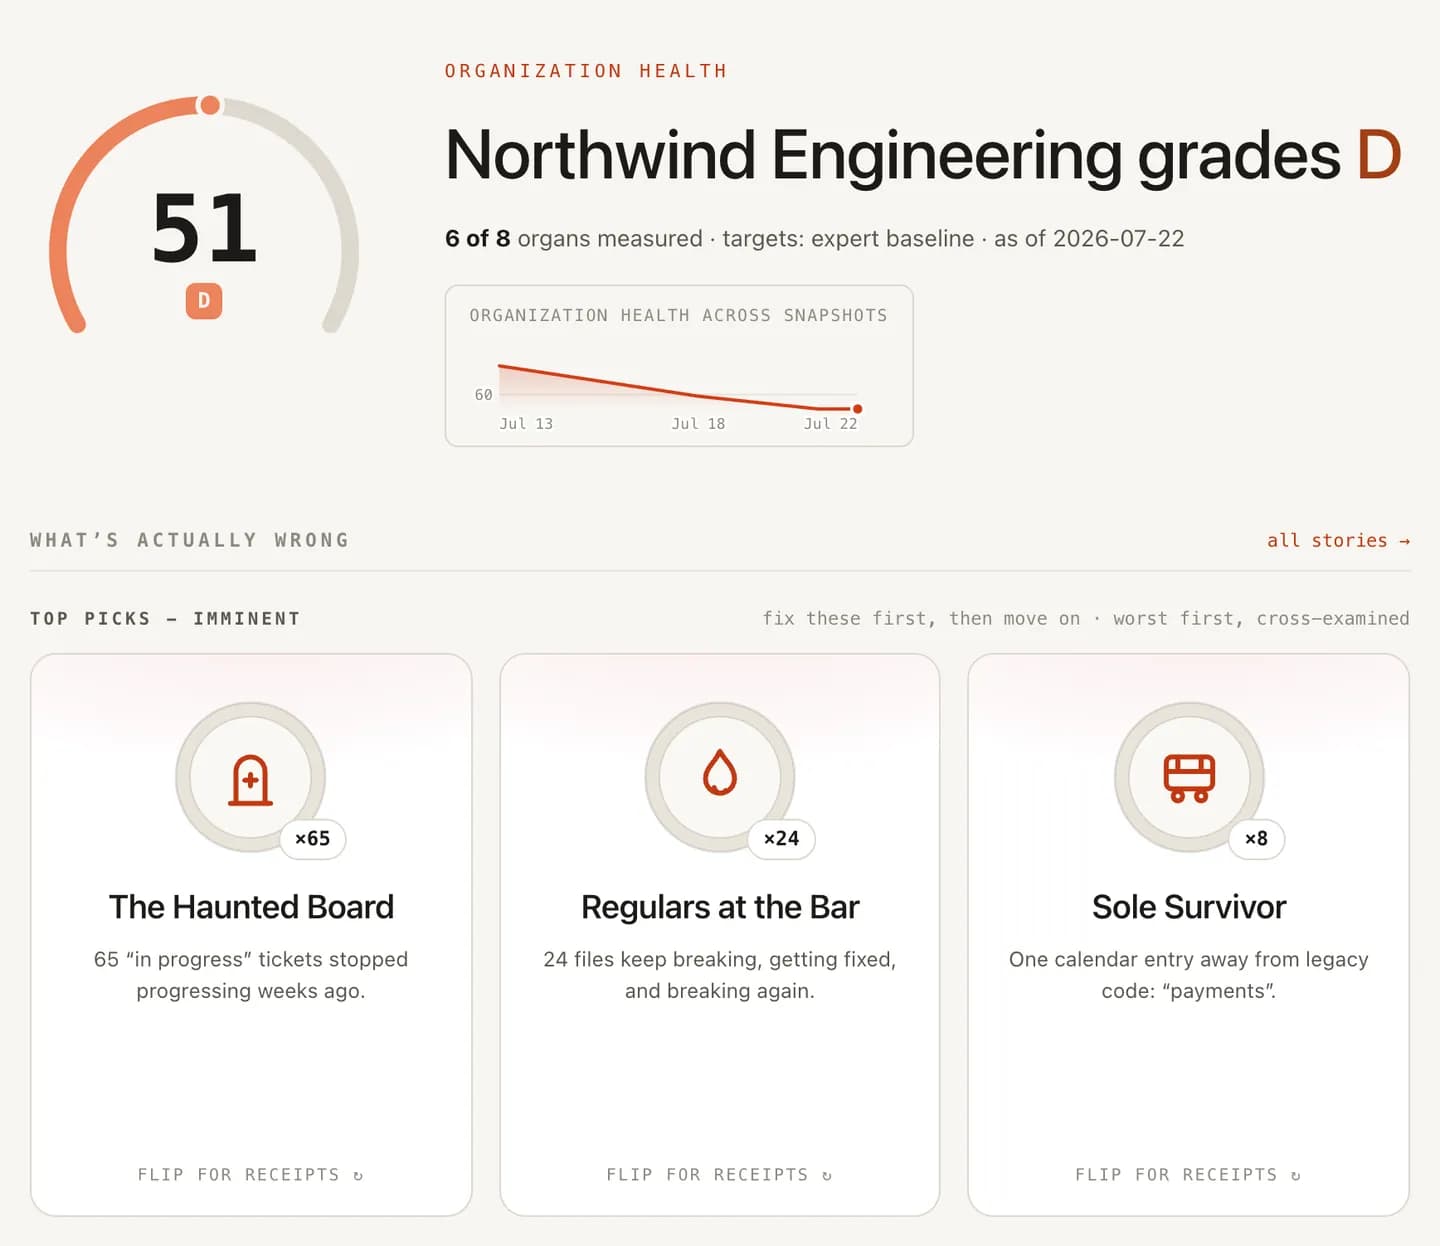
"Our bus factor is fine" is a sentence that means nothing. Bus factor belongs to each area of your codebase separately, and the org-level answer is set by the worst area you actually depend on. Your API layer can be comfortably shared while billing, deploy tooling, and the legacy search service are each one resignation away from having no owner at all.
This article is about those areas: what a bus factor of 1 means mechanically, and how to build the honest inventory of your single-owner zones and decide which ones deserve a fix this quarter. (For the metric from first principles, start with what bus factor is. This piece assumes you know and gets practical.)
What does a bus factor of 1 actually mean?
Mechanically: one person authors nearly all meaningful changes in an area, reviews whatever they didn't author, and holds the unwritten context - why the retry is set to that value, why you never run the backfill on Friday. Remove that one person and the area doesn't slow down; it stops. Changes become archaeology and every estimate becomes a guess. The first production incident in the area lands with no responder.
The researchers who made this measurable define the breaking point precisely. Avelino, Passos, Hora, and Valente (2016) estimate a system's truck factor by weighting degree-of-authorship per file and removing authors greedily until more than half the files have no remaining knowledgeable owner. The number of removals it takes is the truck factor. Their result across 133 popular GitHub systems: 45 of them, or 34%, sat at exactly 1, and roughly 65% at 2 or less. A third of the most successful open-source projects on GitHub were one departure from a stalled codebase, and your internal repo doesn't have their contributor pipeline.
A bus factor of 1 is, in other words, the default state of an unmanaged codebase. You have to fix it on purpose.
Why single-owner areas form (and why nobody notices)
No one plans a bus-factor-1 zone. They accumulate from locally reasonable decisions: route the ticket to whoever's fastest, and don't interrupt the person who's clearly got it handled. Every one of those calls is correct in the sprint it's made. Compounded over two years, they concentrate an entire subsystem into one head.
Worse, while the owner is present, a bus-factor-1 area looks like efficiency. Questions get answered in minutes and PRs merge fast. Every metric you normally watch rewards the concentration, and the cost stays invisible until it's total - which is why this risk survives in orgs that are otherwise rigorous about redundancy. The same dynamic viewed from the person's side is key-person risk, and viewed as an availability problem it's a single point of failure. This article stays on the codebase side: which zones, in what order.
And to say it plainly: nobody should be blaming the owner. They're usually the person who kept saying yes to the service nobody else wanted. Roast the system that let ownership concentrate; thank the human holding it up.
How to inventory your bus-factor-1 areas
You need git history, a recent window (6-12 months, since old contributions fade), and an honest definition of "meaningful contribution." Then:
- Split the codebase into areas. Directories, services, or modules: whatever level a ticket actually lands on. Company-wide numbers hide everything, and per-file numbers drown you in noise.
- Count authorship per area, weighted. Raw commit counts lie: a rename bot beats your architect. Weight by meaningful changes. The degree-of-authorship approach is the honest method, the same math the truck-factor researchers validated.
- Add the review dimension. Reviewers accumulate real knowledge without authoring a byte. An area with one author but three active reviewers is in far better shape than the inventory suggests - and an area where one person is both sole author and sole reviewer is your reddest flag.
- List every area where one name dominates both lists. That's your bus-factor-1 inventory. Expect it to be longer than you'd guessed.
Which orphan-risk areas to fix first
Not all of them. Spreading effort across every flagged zone is how teams spread nothing. Rank the inventory on two axes:
- Blast radius: if this area went dark tomorrow, how much of the product stalls? Money paths, deploy tooling, and anything in the critical path of every request rank high. A single-owned corner you're about to delete is trivia.
- Activity: how much is this code changing? A hot, single-owned area compounds risk with every sprint; a dormant one can wait.
Hot and critical and single-owned: fix this quarter. Critical but dormant: write a runbook and move on. Hot but low-stakes: let the next feature rotate someone in naturally. Neither: skip without guilt.
The fixes themselves (review rotation, author/reviewer swaps, docs anchored to churn) are ranked by cost in how to reduce bus factor. The short version: the cheapest redundancy is letting a second person earn context on the expert's diffs, and one deliberately slower feature buys structural coverage forever.
The cost of waiting for the exit interview
The quiet tax runs the whole time. In the 2024 Stack Overflow Developer Survey, 45.2% of professional developers agreed that knowledge silos prevent them from getting ideas across the organization, and 61% reported spending more than 30 minutes a day searching for answers or solutions. Much of that searching is people routing around knowledge that exists in exactly one head. Every bus-factor-1 area is a silo already charging interest.
The loud cost arrives with a resignation letter, timed by the leaver. At that point your options collapse to a two-week knowledge-transfer sprint from someone whose motivation has already left the building; the triage for that scenario is its own article, your senior engineer quit, now what. Doing the inventory a quarter earlier, calmly, was cheaper.
The inventory is the part teams skip because it feels like work. It's an afternoon with git history.
Or zero afternoons: a continuously computed ownership map, with every bus-factor-1 zone flagged and ranked by blast radius, is what Busfactor's knowledge view renders from the history you already have. Either way, get the list before the list gets you.
Frequently asked
What does a bus factor of 1 mean?
It means exactly one person can meaningfully work on an area of your codebase. If that person leaves (resignation, burnout, parental leave, a better offer) the area is orphaned: nobody left can safely change it, debug it, or explain why it works the way it does.
How common is a bus factor of 1?
Very. Research on 133 popular GitHub systems found 34% at a truck factor of exactly 1, and roughly 65% at 2 or less. And those are successful open-source projects with public contributor pools; internal codebases without volunteers waiting in the wings are usually no better.
How do I find my bus-factor-1 areas?
From git history. For each area of the codebase over the last 6-12 months, list who authored meaningful changes and who reviewed them. Areas where one name dominates both lists are your bus-factor-1 zones. No survey needed; the history already knows.
Do I need to fix every bus-factor-1 area?
No, and trying to is how teams fix nothing. Rank the zones by blast radius, meaning how much of the product stalls if the area goes dark, and by how actively the code changes. Fix the hot, critical, single-owned areas first and skip dormant corners without guilt.