The Same Three Files Keep Breaking. It's Not the Files.
IT'S NOT THE FILES
Every release ships a follow-up fix, always in the same corner of the codebase. Measure hotfix rate and blast radius - and retire the hero act.
Remove the gateway and the chain breaks.
Illustrative example
TL;DR: When a meaningful share of your releases needs a follow-up fix, and the fixes keep landing in the same handful of files, your team is running an unmeasured system. "That part is just fragile" is a measurement you refused to take, and "only one person touches it" is the second half of the same finding. Count your hotfix rate, map where the hotfixes land, and check how many areas depend on the one person who dares change them. Then fix it as what it is: an ownership and test-coverage problem.
Friday: the release goes out. Monday: the hotfix goes out. Everyone in the standup nods, because this is not news. The fix is in that module, the one with a reputation, and the PR author is the same name as last time, because nobody else will touch those files without a strong coffee and a prayer.
Your team has a whole vocabulary for this. "That part of the system is just fragile." "We know it's temperamental." "Ask Dana before you go near it." What it doesn't have is a number. Count it, and "temperamental" turns into a line item with a trend, a file list, and a single point of failure attached.
"Fragile" is a claim. Churn is a measurement.
The research on this is old, solid, and blunt. Nagappan and Ball showed at Microsoft - validated on Windows Server 2003 - that relative code churn measures are highly predictive of a component's defect density. The files that change the most, relative to their size and surroundings, are where the defects live.
Your "temperamental module" is churning, and churn predicts exactly the Monday you keep having. That's the mechanism behind rework generally: delivered work that bounces back is the most expensive kind, because you already celebrated it once.
The ownership half is just as well documented, and it cuts both ways. Bird et al. studied Windows Vista and Windows 7 and found that components with more low-expertise, drive-by contributors had more failures, while a higher ownership share for the top owner meant fewer. Read that carefully, because it's a fork: your guardian engineer is genuinely protecting quality. The Friday-night hotfix written under pressure by whoever happened to be around is precisely the failure-shaped change the data warns about. The guardian isn't the dysfunction.
The dysfunction is what the guardian's existence does to the org. Avelino et al. found that 34% of 133 studied systems had a truck factor of exactly one, a single person whose exit orphans code. If your most fragile, most-hotfixed files are also your most concentrated ownership, you've stacked the two risks on top of each other, and the code most likely to break is the code fewest people can fix. That puts a single point of failure directly on your release path: the textbook case the bus factor literature keeps warning about, and the reason ownership models matter more than style debates ever will.
And for calibration, so nobody argues from vibes: hotfix rate has no published industry band, but its cousin does. DORA's 2024 tiers put change failure rate at roughly 5% for elite performers and roughly 40% for low ones. If every second release of yours ships a sequel, you know which end of that spread you're living on.
The free diagnosis: one afternoon, four numbers
- Count the hotfixes. Merged PRs from the last 90 days whose title or branch name says "hotfix", divided by releases in the same window. Conservative by design: it counts only what your team already confessed to in its own naming.
- Map where they land. Take each hotfix diff and list the files it touched. Rank files by how many separate hotfixes they appear in. Most teams find the distribution is brutally concentrated - a handful of paths soak up most of the emergencies. Now "that part is fragile" has coordinates.
- Check who else can touch them. For each recurring file: how many distinct people merged a change to it in the last 12 months? If the answer is one, run the thought experiment the bus factor fire drill formalizes. Dana is unreachable for two weeks and the file breaks on Friday. Who fixes it, and how long does the archaeology take?
- Check the tests. For each recurring file: when it changes, does a test change with it? A file that breaks every release with no test sibling is uninsured.
Then spend the findings correctly. Treat the recurring hotfix files as a budget line, and skip the "be more careful" speech. Grow a second owner deliberately: the next three changes to those files get pair-written or pair-reviewed with the guardian, and low-risk changes get routed to the trainee on purpose. Put a test harness around the top two files before any refactor. And if the refactor itself needs selling upstairs, the recurrence count is the business case: here are the file paths, here are the emergencies each one caused this quarter, here's the payroll they consumed.
What doesn't work: leaving it to heroics. Every quarter the guardian absorbs the hotfixes is a quarter the knowledge gap widens, the key-person risk compounds, and the org quietly converts an engineering problem into a resignation-letter problem.
How you'd actually see this in Busfactor
The afternoon of counting is a biopsy; the disease is chronic. Busfactor runs the same arithmetic continuously from your GitHub data. It counts hotfix PRs the honest way (merged PRs that literally say "hotfix" in the title or branch, disclosed as exactly that, so the number never overclaims) and trends the count in its delivery views.
Its hotspot ranking surfaces the files where fixes keep concentrating, scored by churn times bug-fix recurrence, with the receipt attached to each file: how many of its recent touches were fixes. Alongside sit the regression loops - fixes that had to be fixed again within weeks, the purest signature of fragility. And it states the fork on the surface: a fix-collecting file can be a defect magnet or just the frontier where the product is being built hardest, and the tool argues both readings instead of pretending one.
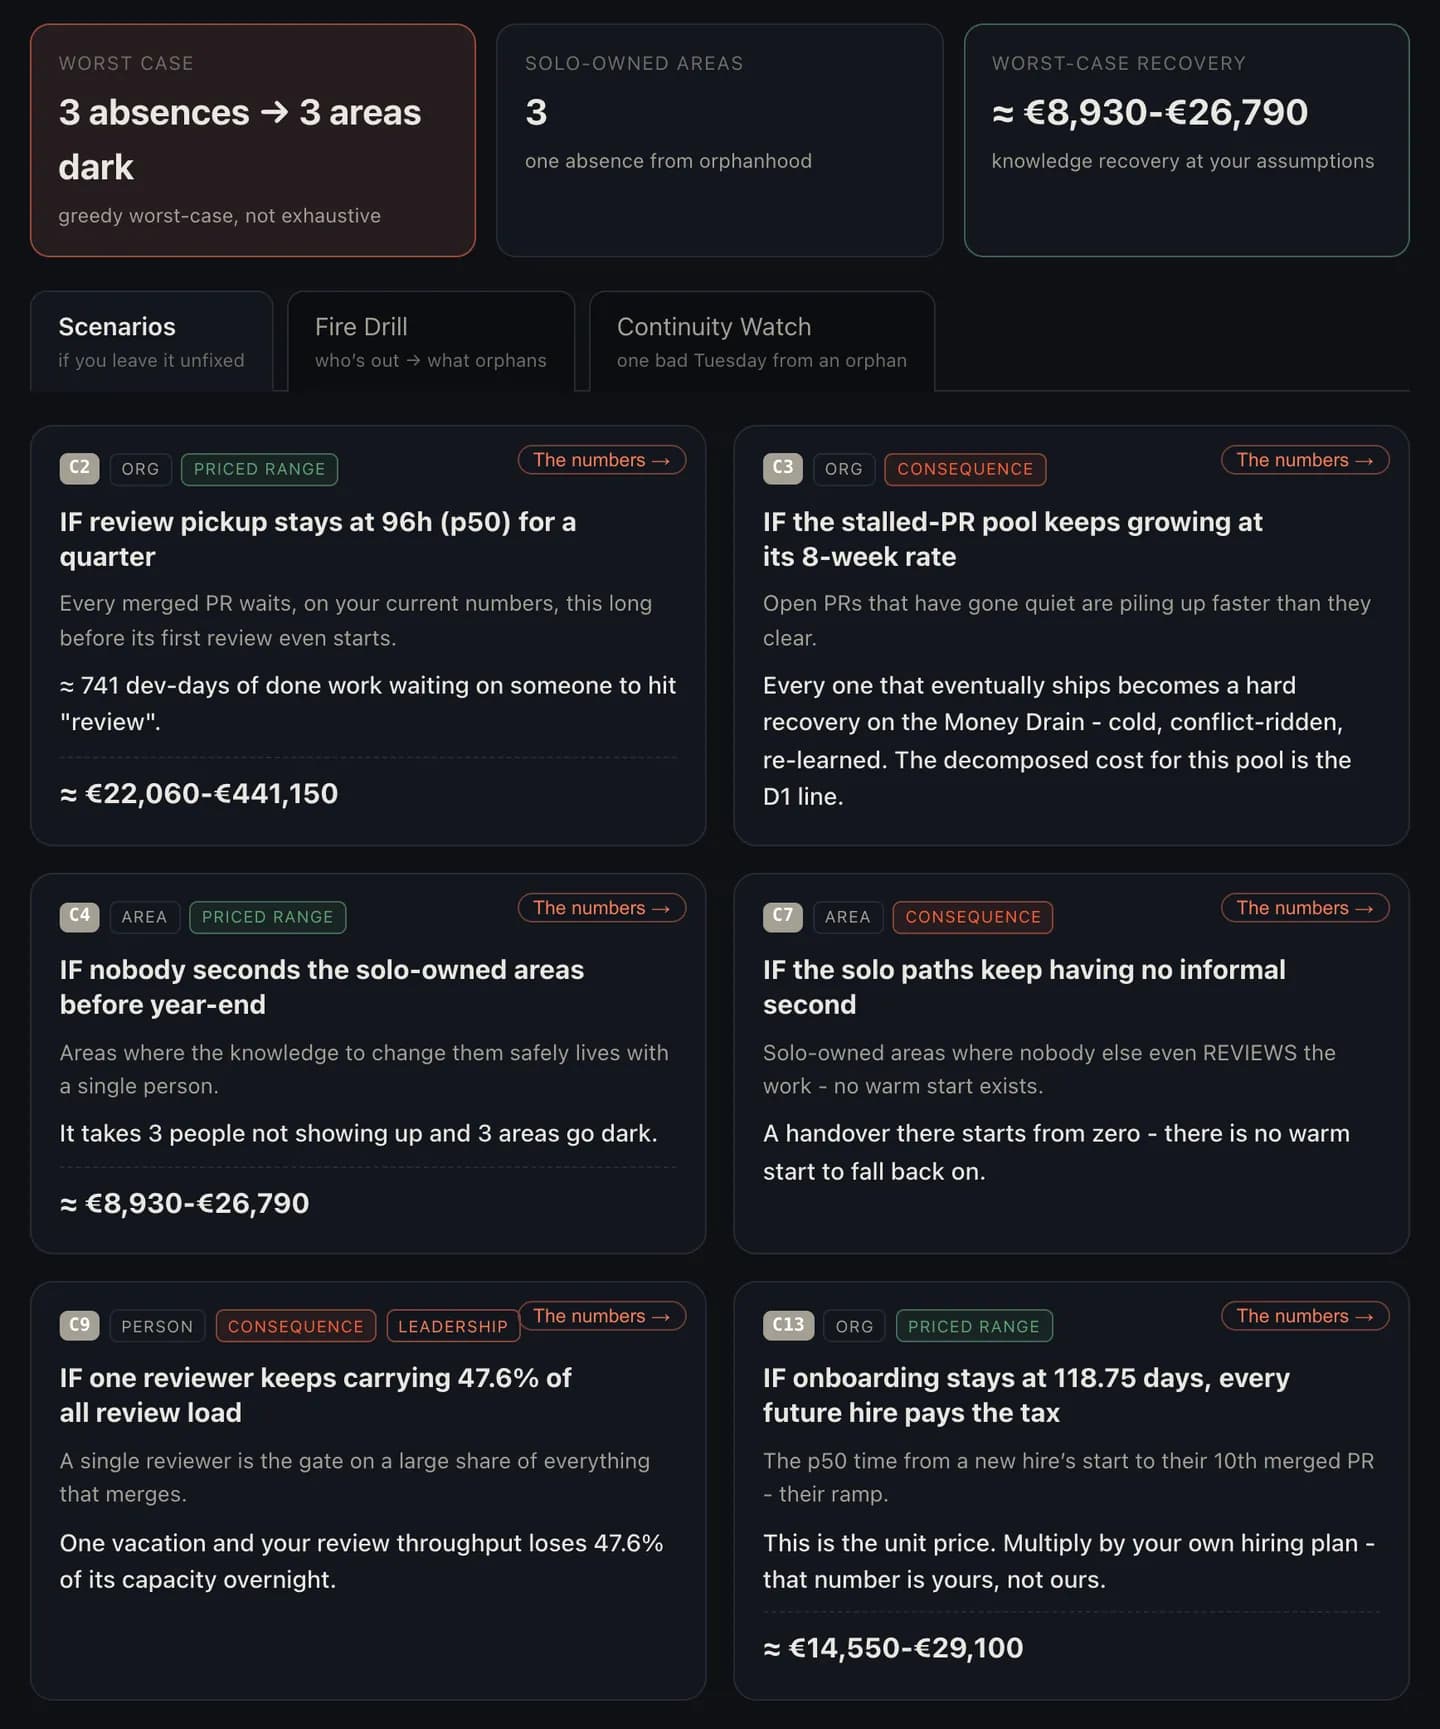
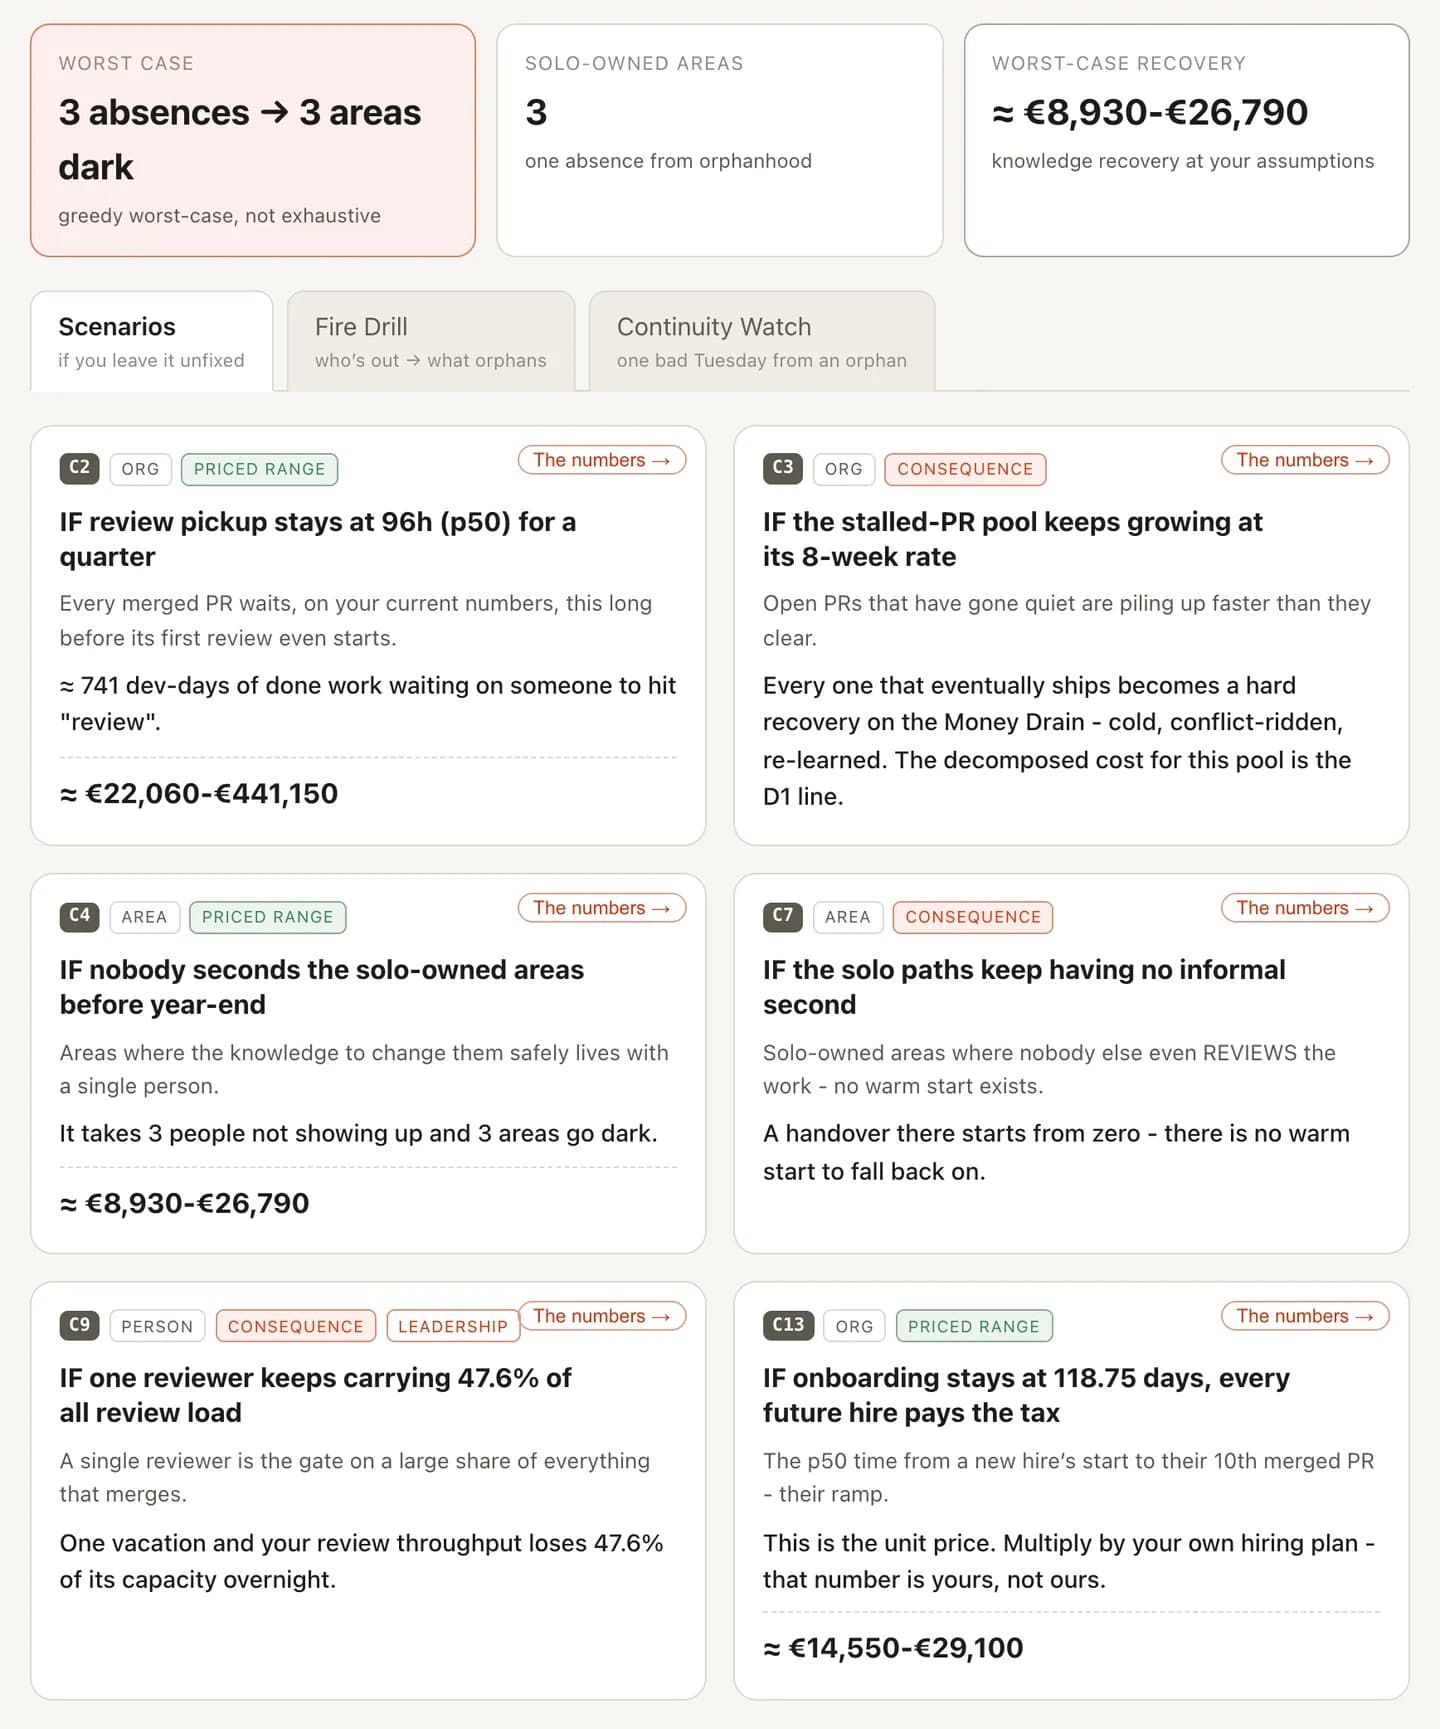
The ownership half lives in the knowledge map: per-area bus factor on a rolling 90-day contribution window, and per-person blast radius - how many areas critically depend on each contributor. When one person's footprint is wide enough that their absence orphans multiple areas, the consequence engine turns it into a sentence a budget owner can act on - how many areas go dark and what the recovery would cost, as a disclosed-assumptions range - instead of an abstract risk score.
The honest limits: the hotfix count is only as good as your naming discipline, so a team that never types "hotfix" will look cleaner than it is, and the number says so rather than guessing. Fix classification reads commit messages, not intent. And blast radius reads git rather than your org chart, so the guardian who reviews everything without committing shows up smaller than reality. The conversation about who should own those files still has to happen with humans; the tool's job is to make it happen over a ranked file list instead of folklore.
The door
Run the 90-day count this week: hotfix PRs, the files they cluster on, the number of people who dare touch them, the test siblings. One afternoon, four numbers, and "that part is just fragile" becomes a file list with a budget attached. Then, if you'd rather the counting never stop: get your org's free read. The hotspots, the regression loops, and the one name carrying it all surface from your real history, with receipts and the fix attached to every finding.
Frequently asked
What is a good hotfix rate?
There is no published industry band for hotfix rate specifically: anyone quoting one invented it. The nearest calibrated cousin is DORA's change failure rate, where the 2024 tiers run from roughly 5% for elite performers to roughly 40% for low. The more useful signals are your own trend (is the rate rising?) and concentration (do the hotfixes cluster on the same files?). A flat, spread-out hotfix rate is release friction; a rising, concentrated one is a fragility hotspot with a name and a path.
How do I measure hotfix rate from git?
Count merged PRs whose title or branch name contains the word 'hotfix' over the last 90 days, and divide by your releases in the same window. It's deliberately conservative: it only counts what your team explicitly labeled as a hotfix, so it undercounts orgs with sloppy naming and never overcounts. Then map each hotfix diff to the files it touched and rank files by how many separate hotfixes they appear in. The ranking is the diagnosis; the rate is just the headline.
What is blast radius in software engineering?
Bus factor asks, per area of the codebase: how many people would have to vanish before this area is orphaned? Blast radius is the transpose, asked per person: how many areas critically depend on this one contributor? A wide personal blast radius means one absence (vacation, resignation, a bad flu week) degrades many areas at once. It's the number that explains why 'only Dana touches that code' is an org-level risk, not a personnel quirk.
Are files with lots of bug fixes always a problem?
No, and an honest tool says so. A file collecting fixes can be a defect magnet, or it can simply be the frontier: the place the product is being built hardest right now, where iteration is healthy. The tiebreaker is what kind of fixes they are: regressions bouncing back after shipping point to fragility; in-flight iteration points to normal work. Look at recurrence after release, not raw fix counts.
Receipts
- Nagappan & Ball - Use of Relative Code Churn Measures to Predict System Defect Density (ICSE 2005)
- Bird, Nagappan, Murphy, Gall, Devanbu - Don't Touch My Code! Examining the Effects of Ownership on Software Quality (ESEC/FSE 2011)
- Avelino et al. - A Novel Approach for Estimating Truck Factors (ICPC 2016)
- DORA - Accelerate State of DevOps Report 2024