Sprint Velocity: What It Can and Can't Tell You
VELOCITY ISN'T PERFORMANCE
Hover or focus to flip ↻Sprint velocity is a planning tool that gets promoted into a performance metric. What velocity honestly measures, where it lies, and what to track instead.
TL;DR: Sprint velocity is a decent planning heuristic that keeps getting promoted into a job it cannot do: performance measurement. Points are a team-local currency, un-comparable across teams and trivially inflatable within one, so the moment velocity becomes a target or a dashboard star, it stops informing planning and starts performing for management. Keep velocity in the planning meeting where it was born; put real units on the scoreboard: cycle time, plain-count throughput, and the DORA keys. The test is simple. If the number can get better while nothing real improves, it isn't a performance metric.
Somewhere right now a leadership deck contains a velocity chart trending up and to the right, presented as evidence the engineering org is accelerating. The uncomfortable part: that chart can be true while nothing - literally nothing - about the software, the customers, or the delivery system improved. Velocity is the only metric in engineering that a team can double by feeling differently about the number eight.
What is sprint velocity?
Velocity is story points completed per sprint, usually averaged over the last several sprints. Its original job was modest and genuinely useful: a self-calibrating capacity check. The team estimates work in abstract points, observes it historically finishes around a certain amount, and declines to plan meaningfully more than that into the next sprint. Estimation error partially cancels out because the same flawed estimators produce both the history and the plan. As a guard against chronic overcommitment, it's honest work.
Notice what that job description does not include: measuring productivity, comparing teams, or demonstrating improvement to anyone outside the team. The trouble starts precisely where the job description ends.
What velocity can tell you
- How much to plan next sprint. The design purpose, and still legitimate: a stable empirical answer to "how much fits?" that's harder to argue with than optimism.
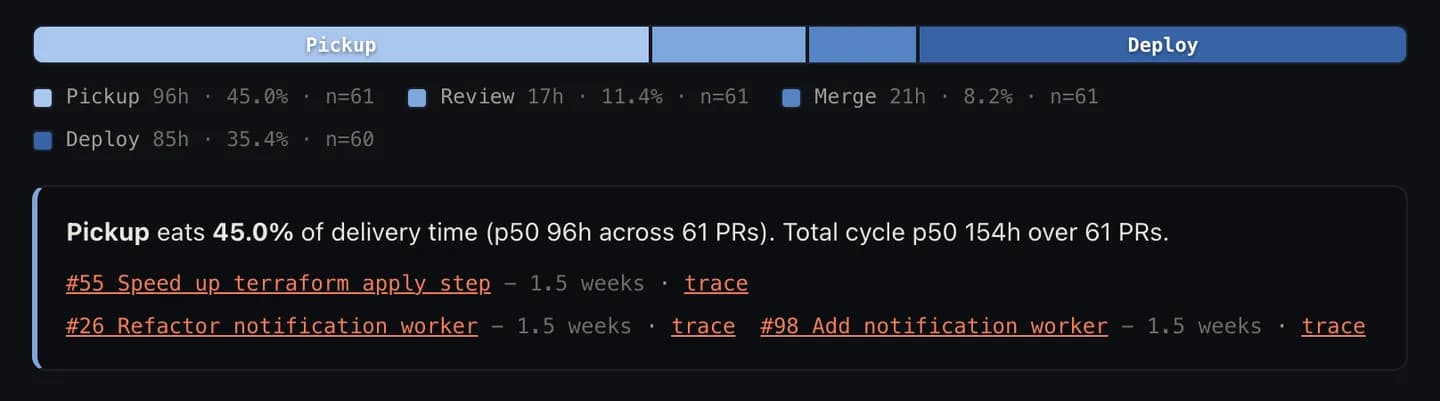
- That something is destabilizing the team. A velocity that swings wildly sprint to sprint is a symptom worth investigating: chronic carryover, interrupt load, dependencies landing mid-sprint, or estimates drifting. The instability is the signal; the level never was. The diagnosis usually lives in the queues, which is flow-efficiency territory rather than estimation territory.
- That planning conversations are happening. A team that estimates together at least talks about scope together. Modest, real, and worth something.
That's the honest list. It's short.
What velocity can't tell you
It can't compare teams. A story point has no exchange rate. Each team's points are calibrated to its own codebase, risk appetite, and estimation folklore; the same change is a 3 on one team and an 8 next door, and neither is wrong. Ranking teams by velocity is ranking countries by the size of the numbers on their banknotes.
It can't measure productivity. The SPACE framework, written in part by the researchers behind DORA, states the finding plainly: developer productivity "cannot be measured by a single metric or dimension," and the paper specifically recommends combining at least three dimensions, including at least one perceptual measure. A single activity number in invented units is the case study in what that warning is about. (This is the same reason individual output metrics mislead; velocity is the team-sized version of the same mistake.)
It can't demonstrate improvement to outsiders. The delivery-performance research tradition never used it: Accelerate built its evidence base on the four keys, real-unit measures of speed and stability, and found high performers were twice as likely to exceed their profitability, market-share, and productivity goals. Points-per-sprint appears nowhere in that causal chain. Outcomes live in real units; velocity's units are feelings, denominated.
When velocity becomes a target
Goodhart's law - when a measure becomes a target, it ceases to be a good measure - is nowhere more mechanical than here, because inflating velocity requires no conspiracy and no effort. Estimates are judgment calls; judged people nudge judgment. Yesterday's 3 becomes today's 5, tickets split into more tickets, and the chart climbs while the code ships at exactly the rate it always did.
The bill lands twice. First, the planning signal, the one thing velocity actually provided, is destroyed, because history in inflated points can't calibrate anything. Second, and worse: leadership now has a chart that says things are improving, which anesthetizes the appetite to fix what's actually slow.
The teams aren't cheating, either. They're responding rationally to being measured in a currency they themselves mint. Roast the system, not the estimators: if your metrics can be improved by re-labeling, you built a re-labeling incentive.
What to use instead of sprint velocity
For everything outside the planning meeting, use units that exist in the physical world:
- Cycle time, decomposed by stage. Hours and days from started to shipped, and where they went. Can't be inflated by estimation vibes; directly points at the fix.
- Throughput as a plain count. Finished items per week, no points. Yes, items vary in size. Over enough weeks, honest counting beats inflatable weighting, and it pairs naturally with WIP limits, since finishing is what moves it.
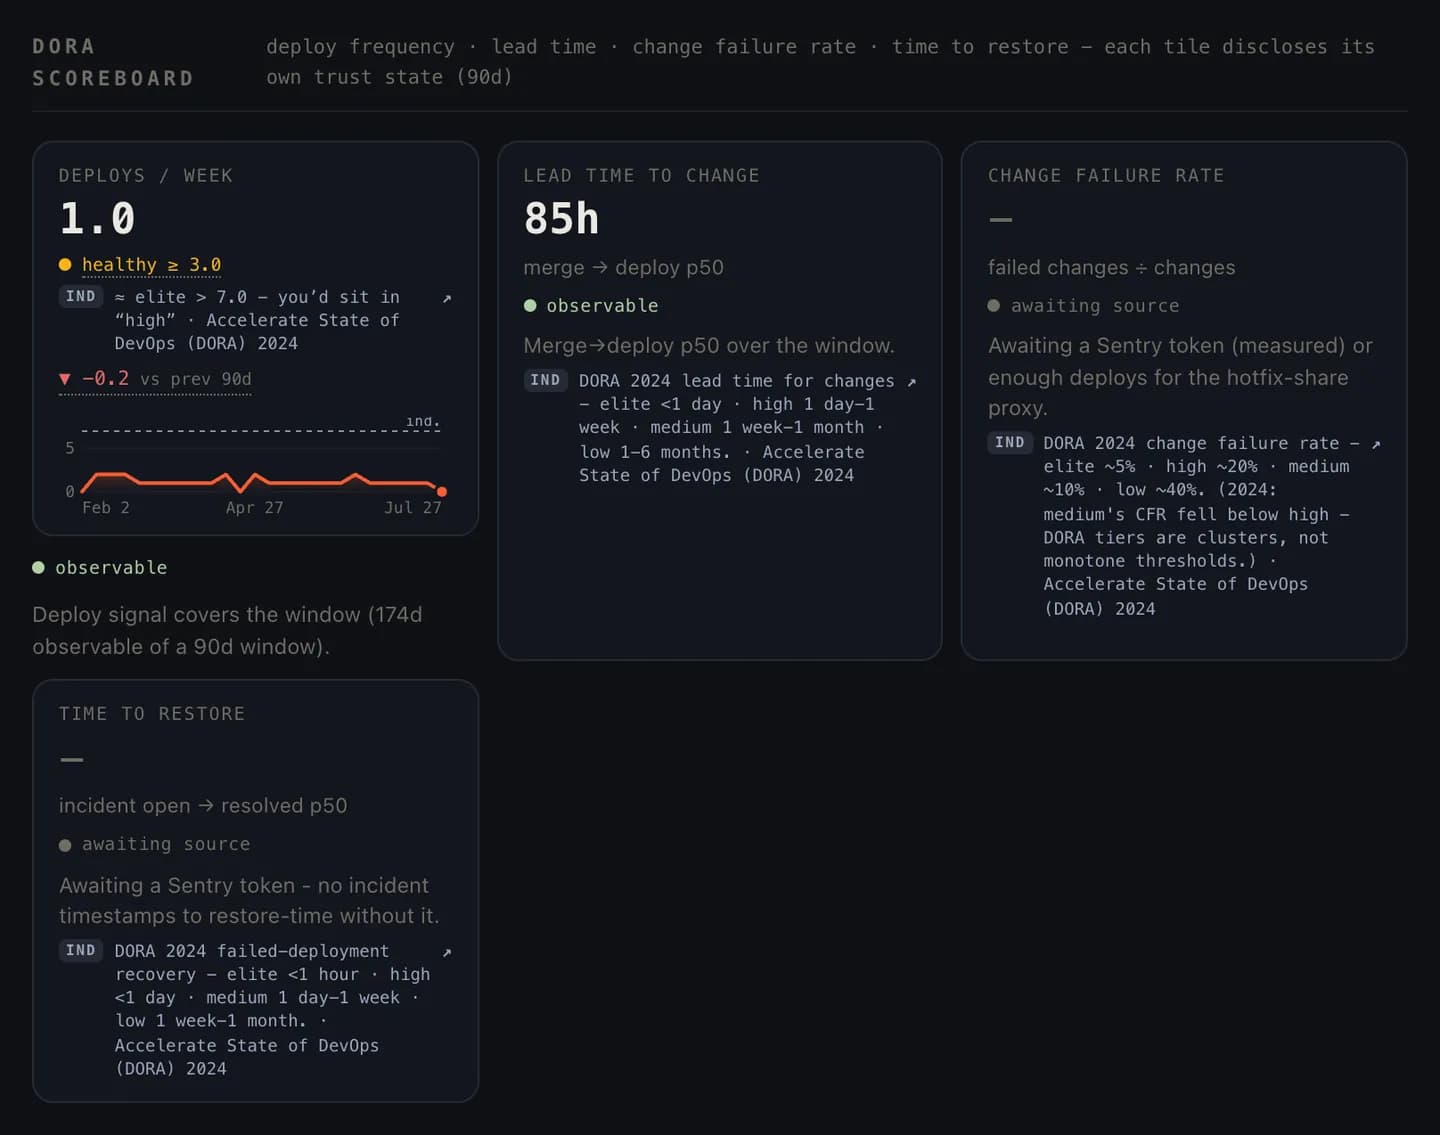
- The DORA four keys. Deployment frequency, lead time, change failure rate, recovery time: speed and stability, in real units, with published reference points from the 2024 report to orient against.
- Velocity, kept but demoted. It goes back to the planning meeting as the team's private capacity heuristic, and it leaves every dashboard, review, and deck. The demotion isn't punishment; it's parole.
The clean test for any metric you're about to put in front of leadership: can this number improve while nothing real gets better? Velocity fails by construction. A rising points chart with flat outcomes is the house metric of a feature factory, and everyone in the building can feel the difference before the dashboard admits it. Cycle time, counted throughput, and the four keys pass, which is why they're the spine of a delivery scoreboard you can defend with a straight face. Velocity is the spine of a chart that eventually gets asked a question it can't answer.
Frequently asked
What is sprint velocity?
Sprint velocity is the number of story points a team completes per sprint, averaged over recent sprints. It was designed as a capacity-planning heuristic: if the team historically finishes about this much, don't plan more than that into the next sprint. It measures planning throughput in the team's own local units, nothing more.
Is velocity a good performance metric?
No, and it wasn't designed to be one. Story points are a team-local currency with no exchange rate; the same work can be a 3 or an 8 depending on who's estimating. The moment velocity is used to judge a team, estimates inflate to meet it, and the planning signal it was built to provide is destroyed in the process.
Can you compare velocity between teams?
No. Each team's points mean something different, calibrated to their own codebase, estimation habits, and definition of done. Comparing velocities across teams is comparing prices in different currencies without an exchange rate. For cross-team conversations, use time-based measures like cycle time, or the DORA four keys, which are defined in real units.
What should you use instead of velocity?
For delivery health: cycle time and its stage breakdown, throughput as a plain count of finished items, and the DORA four keys, all in real units that survive comparison and resist inflation. Velocity can stay for what it was built for: the team's own private answer to how much fits in the next sprint.