The Leak in Your Budget Is a Process, Not a Person
PAYROLL WAS NEVER ITEMIZED
The waste in software development is rarely a person. How to find and price the process leaks - review waits, rework, dead work - hiding in your payroll.
TL;DR: When the budget question lands, the reflex is to look for the underperformer. Wrong direction: the money is leaking through process shapes - review queues, rework, dead work, maintenance load - that no individual controls. You can count all four from your own git and ticket data this week, price the recurring ones at a disclosed loaded rate, and walk into the next budget conversation with an itemized leak list instead of a suspect list. One rule holds throughout: sunk money is gone, and only a measured drop against your own baseline counts as a saving.
The CFO shares a spreadsheet. Engineering is the biggest line item, bigger than sales, much bigger than the cloud bill you renegotiated for a week last quarter. The question under the question is simple: what are we getting for it?
And you feel the reflex kick in. Scan the team. Who's slow? Who's coasting? Somebody must be the leak.
Here's the uncomfortable inversion: you audit a five-figure AWS bill line by line, but payroll - several times bigger - has never been itemized at all. And when it finally is, the leak is almost never shaped like a person. It's shaped like a queue.
What the waste in software development actually looks like
Start with what developers themselves report. Stripe's Developer Coefficient study (a 2018 survey of over a thousand developers and a thousand executives; self-reported, worth remembering) found an average workweek of 41.1 hours, with 17.3 of them going to maintenance work: debugging, refactoring, dealing with bad code. That's over 40% of the paid week not producing new value. Nobody is lazy; the system routes their hours there.
The 2024 Stack Overflow survey adds the friction tax: 61% of developers spend more than 30 minutes every day just searching for answers or solutions, and technical debt is the top frustration at 63%. Interruption research shows why scattered waits cost more than they look: across 10,000+ programming sessions, only about 10% of interrupted sessions resumed real work within a minute, and roughly 30% took over half an hour.
On the queue side, LinearB's benchmarks across 8M+ PRs put elite PR pickup under one hour, while "needs focus" teams leave work waiting beyond sixteen. Every one of those waits is payroll idling, and none of them belongs to a person you could performance-manage away.
Flows, stocks, and sunk: the grammar that keeps you honest
Before you price anything, sort every leak into one of three buckets, because they behave like different kinds of money:
- Flows recur. Review-wait hours per week, rework share, KTLO load, meeting-and-search friction. Flows are the only thing you can honestly quote "per month."
- Stocks sit. A backlog of seventy unreviewed PRs is a one-time cost to clear, not a monthly bleed. Quoting a stock with a per-month verb is how dashboards lie.
- Sunk is gone. The four weeks that went into a feature nobody shipped are not "recoverable" by any tool, consultant, or reorg - ever. What's actionable about sunk cost is only its rate: if dead work keeps happening, that recurring rate is a flow you can shrink going forward.
Most "engineering waste" content (and, frankly, most vendor dashboards) blends all three into one scary number. A CTO or CFO who's any good will call bullshit on the blend, and they'll be right to.
Do this first - free, this week
- Pull four quantities from systems you already run. Median PR pickup time (git), rework share (code substantially rewritten within weeks of merging), dead-work rate (PRs opened and closed unmerged; tickets abandoned mid-flight), and maintenance share of tickets. No new tooling: these are queries.
- Keep the units in hours first. "Roughly sixty engineer-hours a week are waiting on review" is already a board-grade sentence, and it can't be accused of creative pricing.
- Price only the flows, at a disclosed rate. A fully-loaded engineer costs well above base salary. The MIT rule of thumb is 1.25-1.4 times base, and BLS data puts benefits alone at 29.7% of employer cost. State your rate next to every figure. A number with a visible assumption invites discussion; one without invites distrust.
- Fix the cheapest leak first and re-measure. Review SLAs and smaller PRs usually top the payback list. The before/after delta against your own baseline is the only "saving" you should ever put on a slide. A projection is not a delta.
- Retire the suspect list. Share the leak list with the team. Watch the mood shift when the question changes from "who's slow?" to "why does our work wait four days?" The economics lens works better with the people it measures.
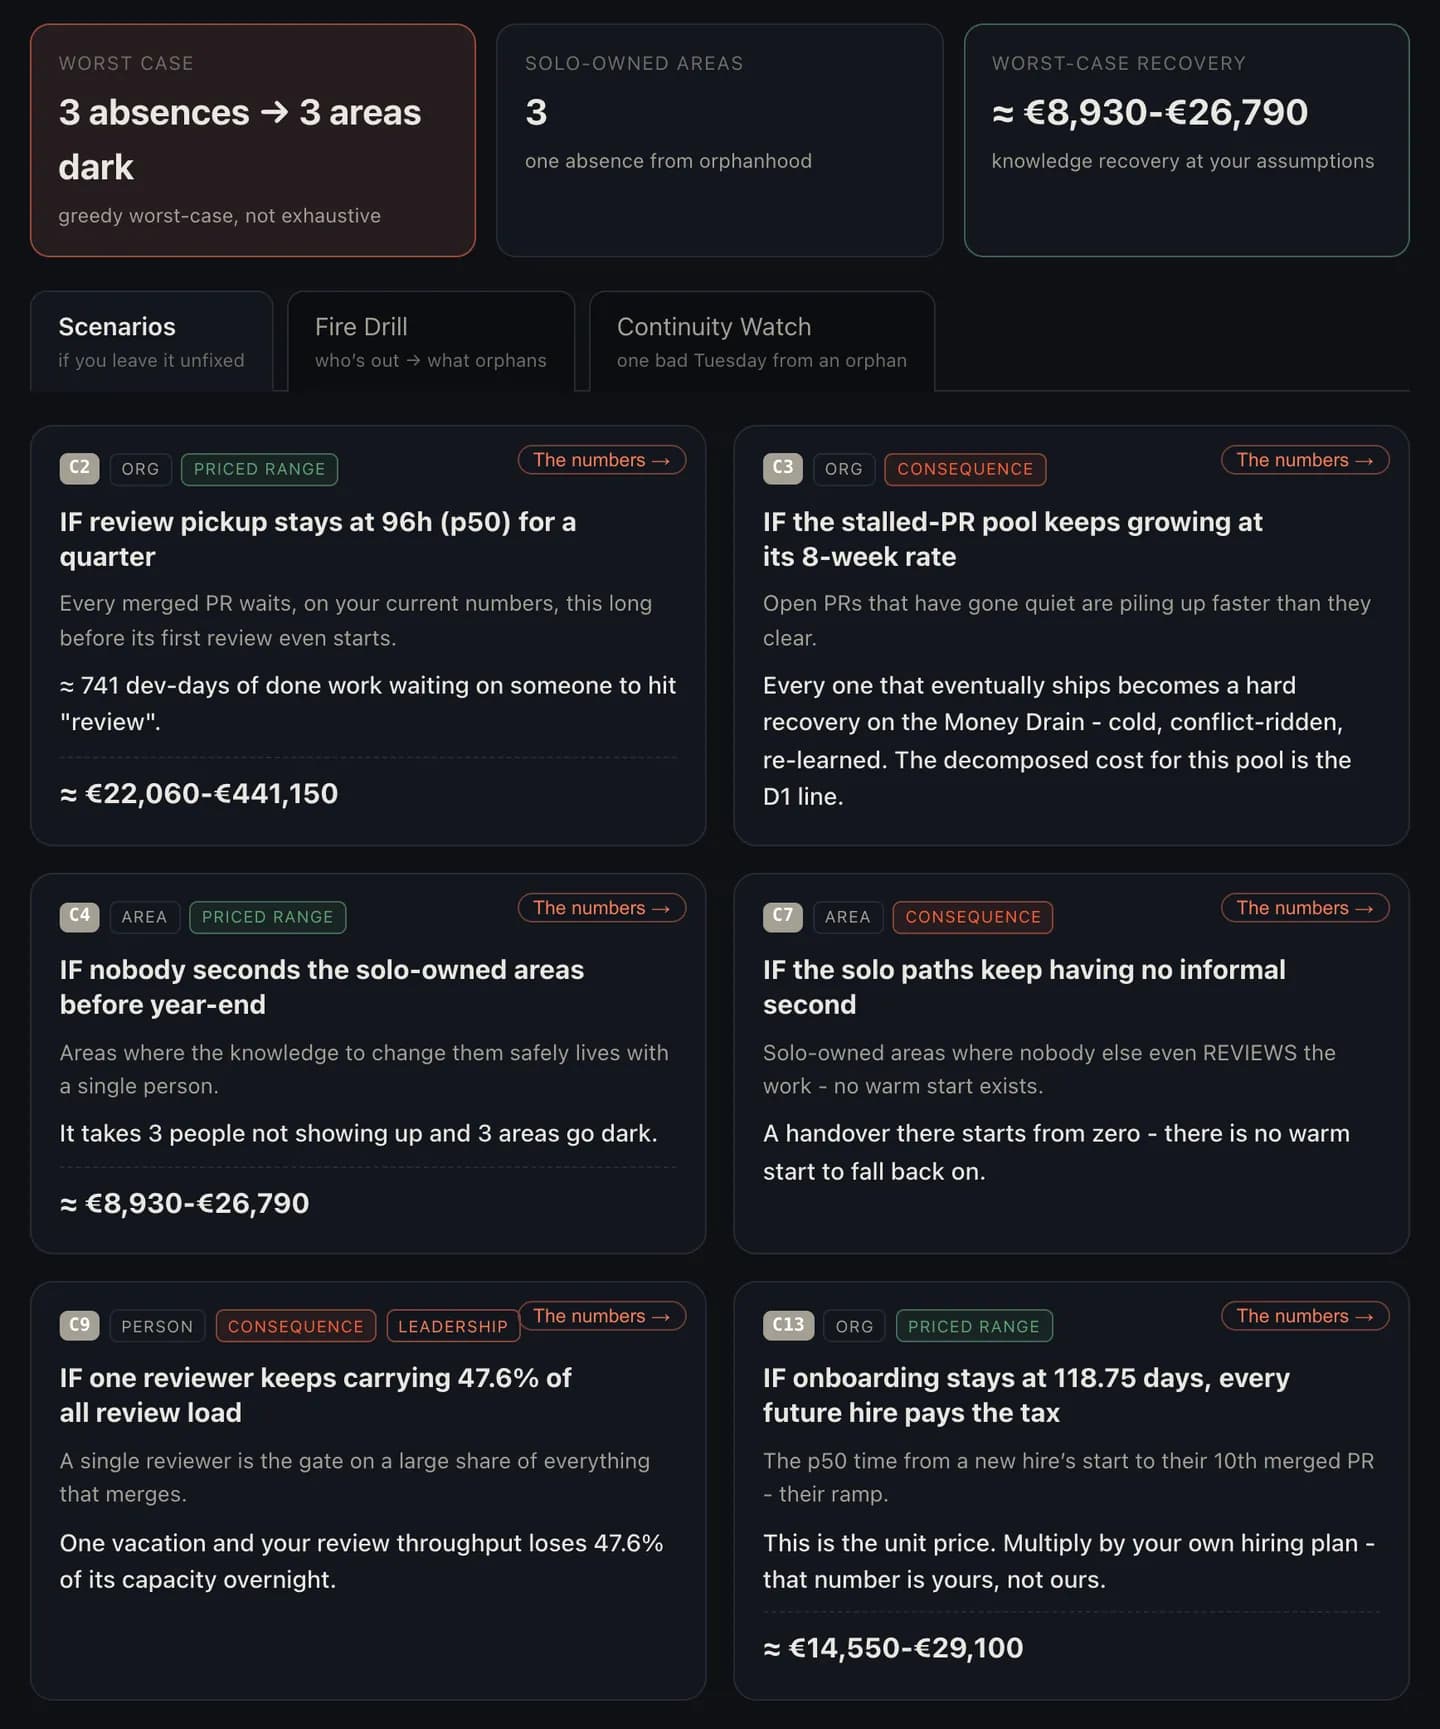
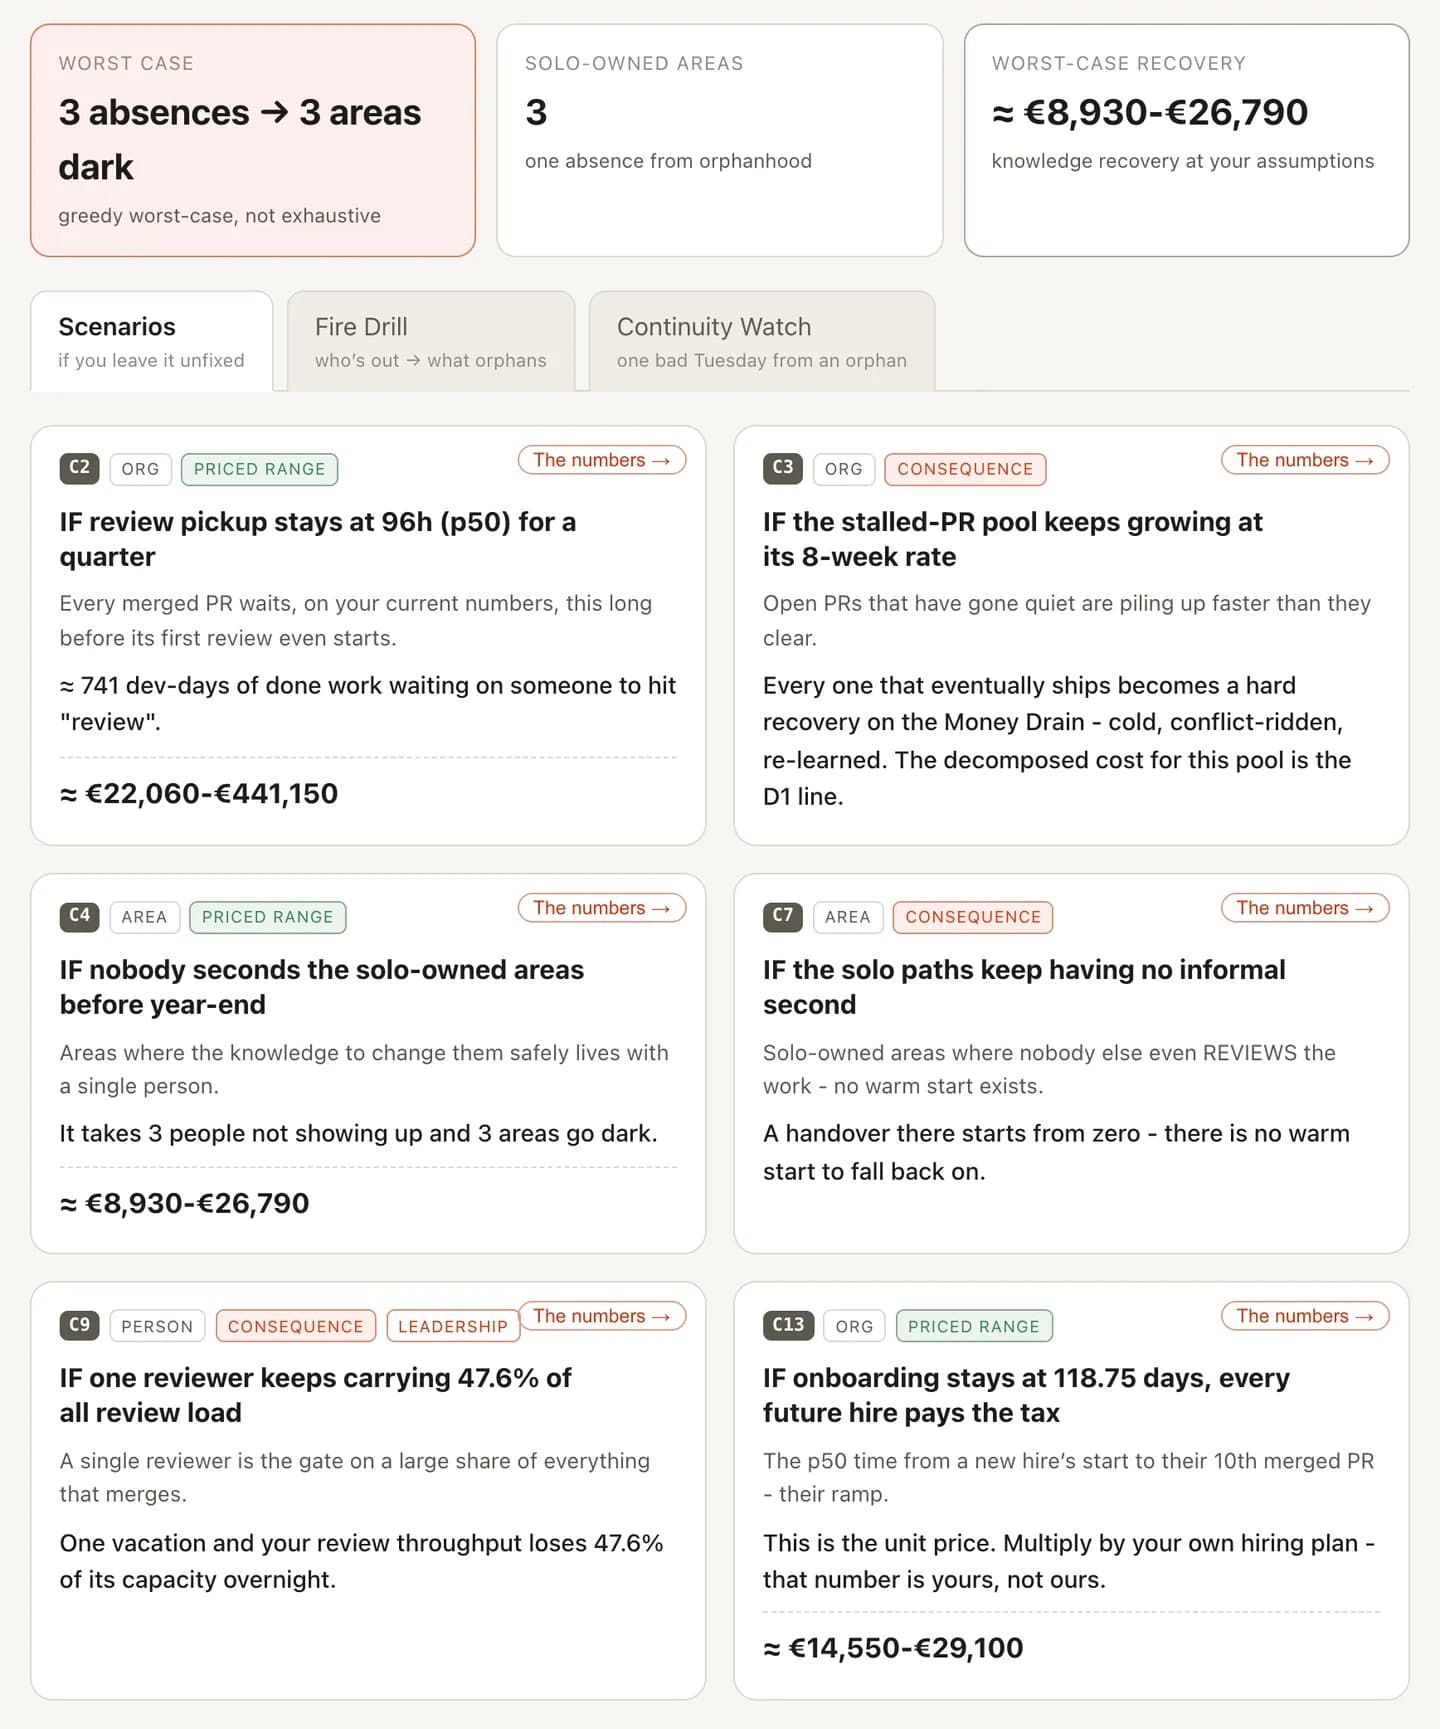
How you'd actually see it in Busfactor
This audit is exactly what Busfactor's Money view automates. Every drain line is decomposed from your own quantities - these PRs, this many hours, at this rate - never a flat industry scare-number; the allocation view shows where the hours actually went (new work, improvements, KTLO, unplanned) with each bucket judged against a healthy range; and every finding carries a fix with a payback estimate, computed at disclosed, org-editable assumptions.
The honest limits are the point. Until you configure real compensation data, rates are industry averages and labeled as estimates. Lines that can't be priced honestly render as counts, not invented currency. And the product will not tell you it "recovered" money for you: sunk stays sunk, stocks aren't quoted as monthly bleeds, and a saving only appears when a waste rate measurably falls against your own baseline. If a dashboard promises better than that, it's promising fiction. Ours would rather be smaller and true.
The door
The budget question is answerable - just not with a name. Pull the four quantities this week, sort them into flows, stocks, and sunk, price the flows at a rate you're willing to defend, and take the itemized list to the CFO before they ask again. If CI waits turn out to be one of your leaks, that one has its own playbook. The person you were about to blame is standing in a queue the process built. Drain the queue, and both your budget and your engineers breathe out.
Frequently asked
Where does waste in software development actually come from?
Mostly from process shapes, not people: work waiting in review queues, rework on code that came back, dead work that was authored but never shipped, and maintenance load crowding out new development. Survey data consistently shows developers spending a large share of their week on maintenance and debt rather than on new value.
How do I price engineering waste honestly?
Count quantities first - hours waiting, PRs abandoned, share of tickets that are maintenance - from your own git and ticket data. Convert to money only with a disclosed fully-loaded rate, and only for recurring flows. A backlog is a one-time cost to clear, not a monthly bleed, and money already spent is sunk - no tool or process change gets it back.
Can I recover the money engineering has wasted?
No - sunk cost is sunk, and any pitch claiming otherwise is selling you something. What you can do is stop the leak going forward, and the only honest proof is a measured one: the waste rate falling against your own baseline, or a recurring cost actually cancelled. Projections dressed as savings are how money theater starts.
Receipts
- Stripe, The Developer Coefficient (September 2018)
- Stack Overflow Developer Survey 2024 - Professional Developers
- Parnin & Rugaber, Resumption strategies for interrupted programming tasks (2011)
- LinearB, Engineering Benchmarks
- Hadzima, How Much Does an Employee Cost? (MIT)
- U.S. BLS, Employer Costs for Employee Compensation (March 2025)