Technical Due Diligence: The Engineering Checklist (2026)
THE ENGINEERING CHECKLIST
The engineering-health checklist for investors, acquirers, and incoming CTOs: bus factor, delivery, review coverage, KTLO - and numbers you can re-derive.
TL;DR: This is the checklist for the other side of the table: the investor, acquirer, or incoming CTO who has to judge an engineering org from the outside, fast, with money on the line. (If you're the one being diligenced, the companion piece is the seller-side view: what acquirers actually check, and how to prepare.) The good news: almost everything that matters is derivable from history the target already has - git, tracker, CI, incidents. The discipline is refusing numbers you can't re-derive. Vibes, vendor dashboards with undisclosed models, and slideware averages all fail that bar; rows and receipts pass it.
Why engineering health, not code quality
A diligence week is short and a codebase is large, so the classic mistake is spending the week reading code. Code style tells you where the code is today; the deal is buying the org's continued ability to change the product. That ability is an economic property of the org, and it degrades along five measurable axes long before anyone would call the code "bad." The second classic mistake is accepting the target's own dashboard as evidence. The standard that keeps you honest is simple: any number that matters must be re-derivable from the underlying history by your side. Hold that bar and the rest of this checklist is mechanical.
The technical due diligence checklist: five areas, one evidence bar
1. Knowledge concentration: the bus factor map
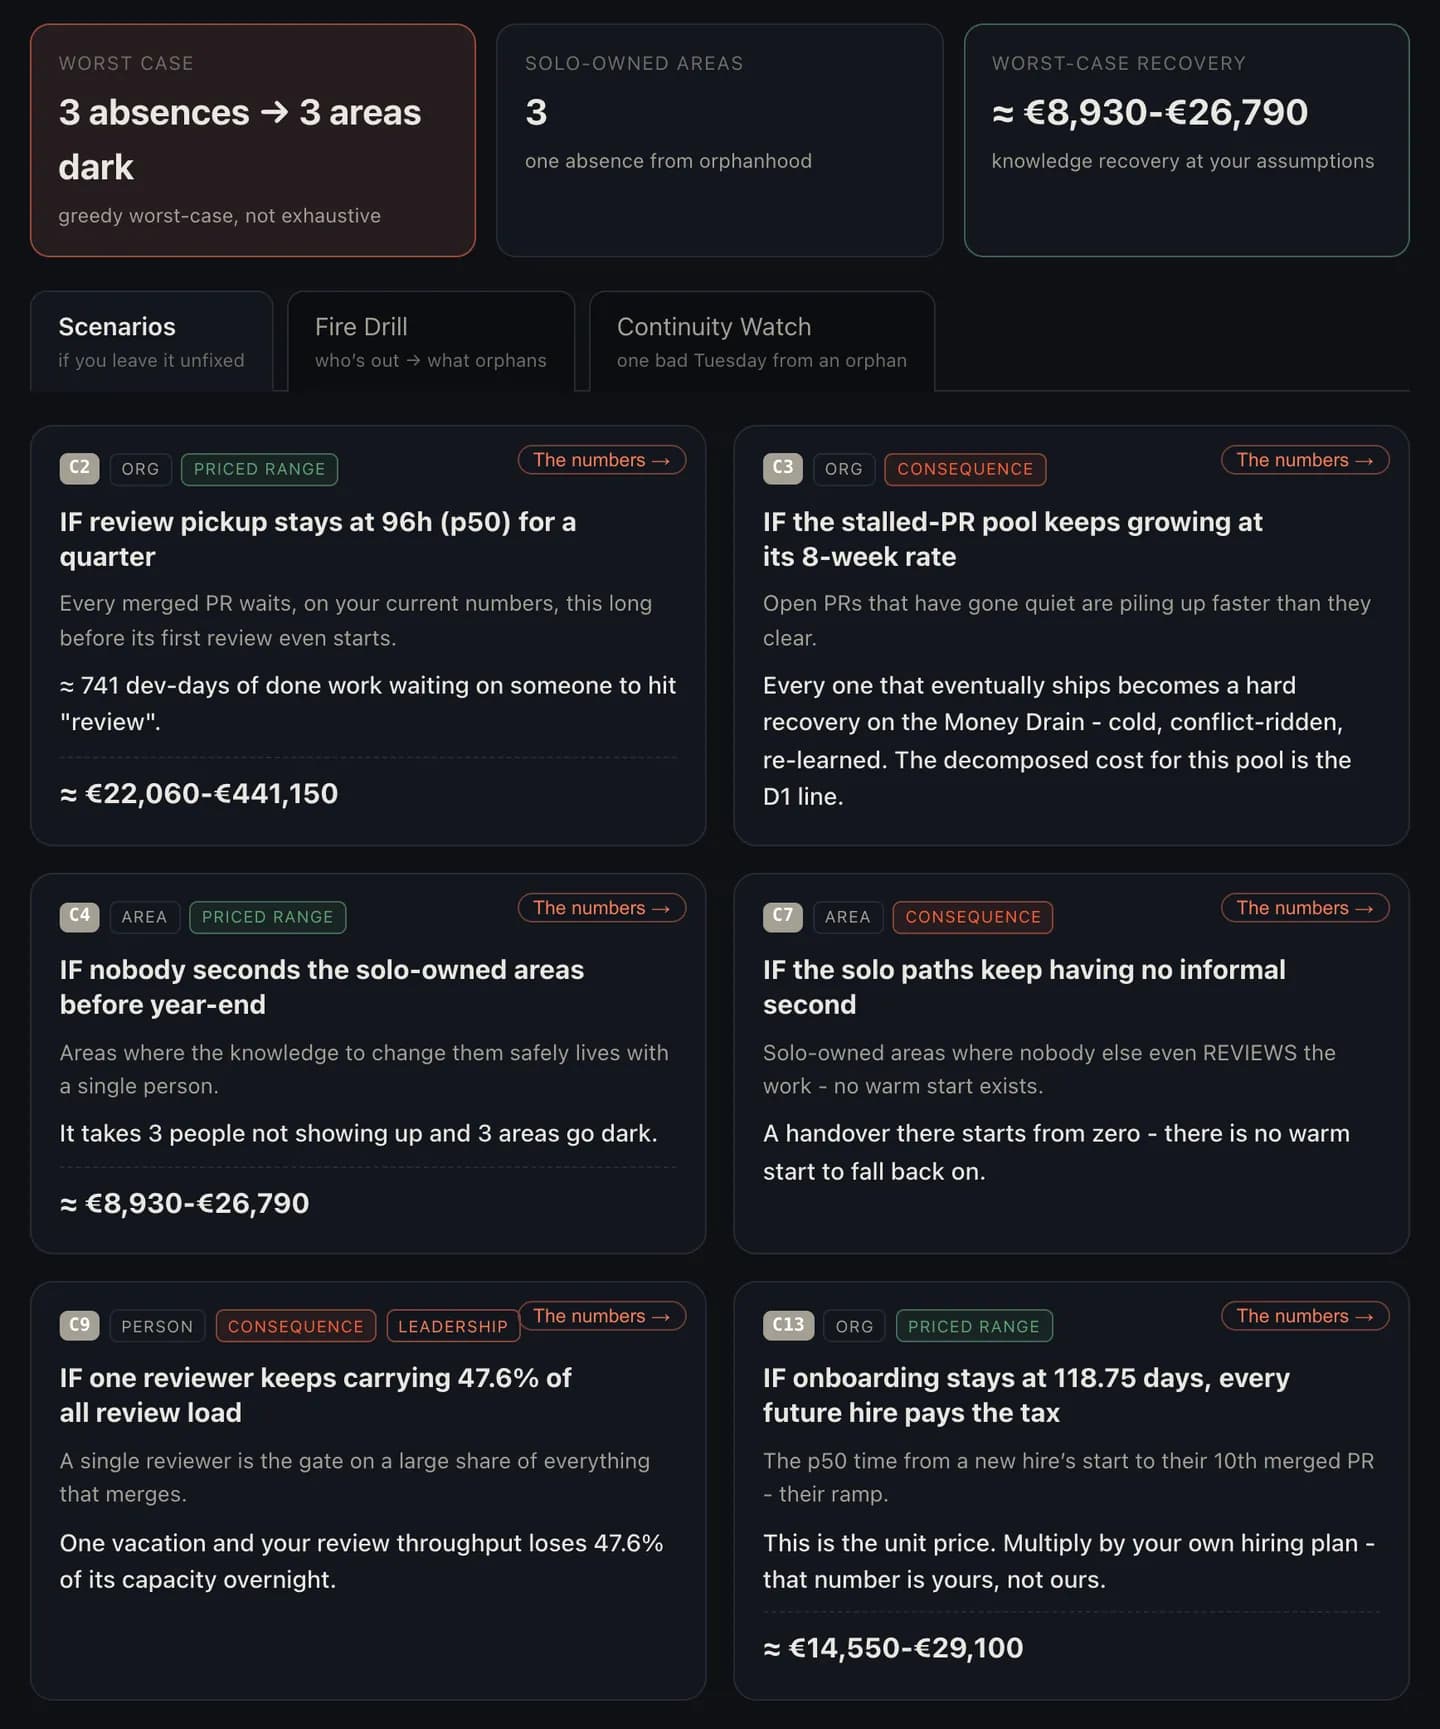
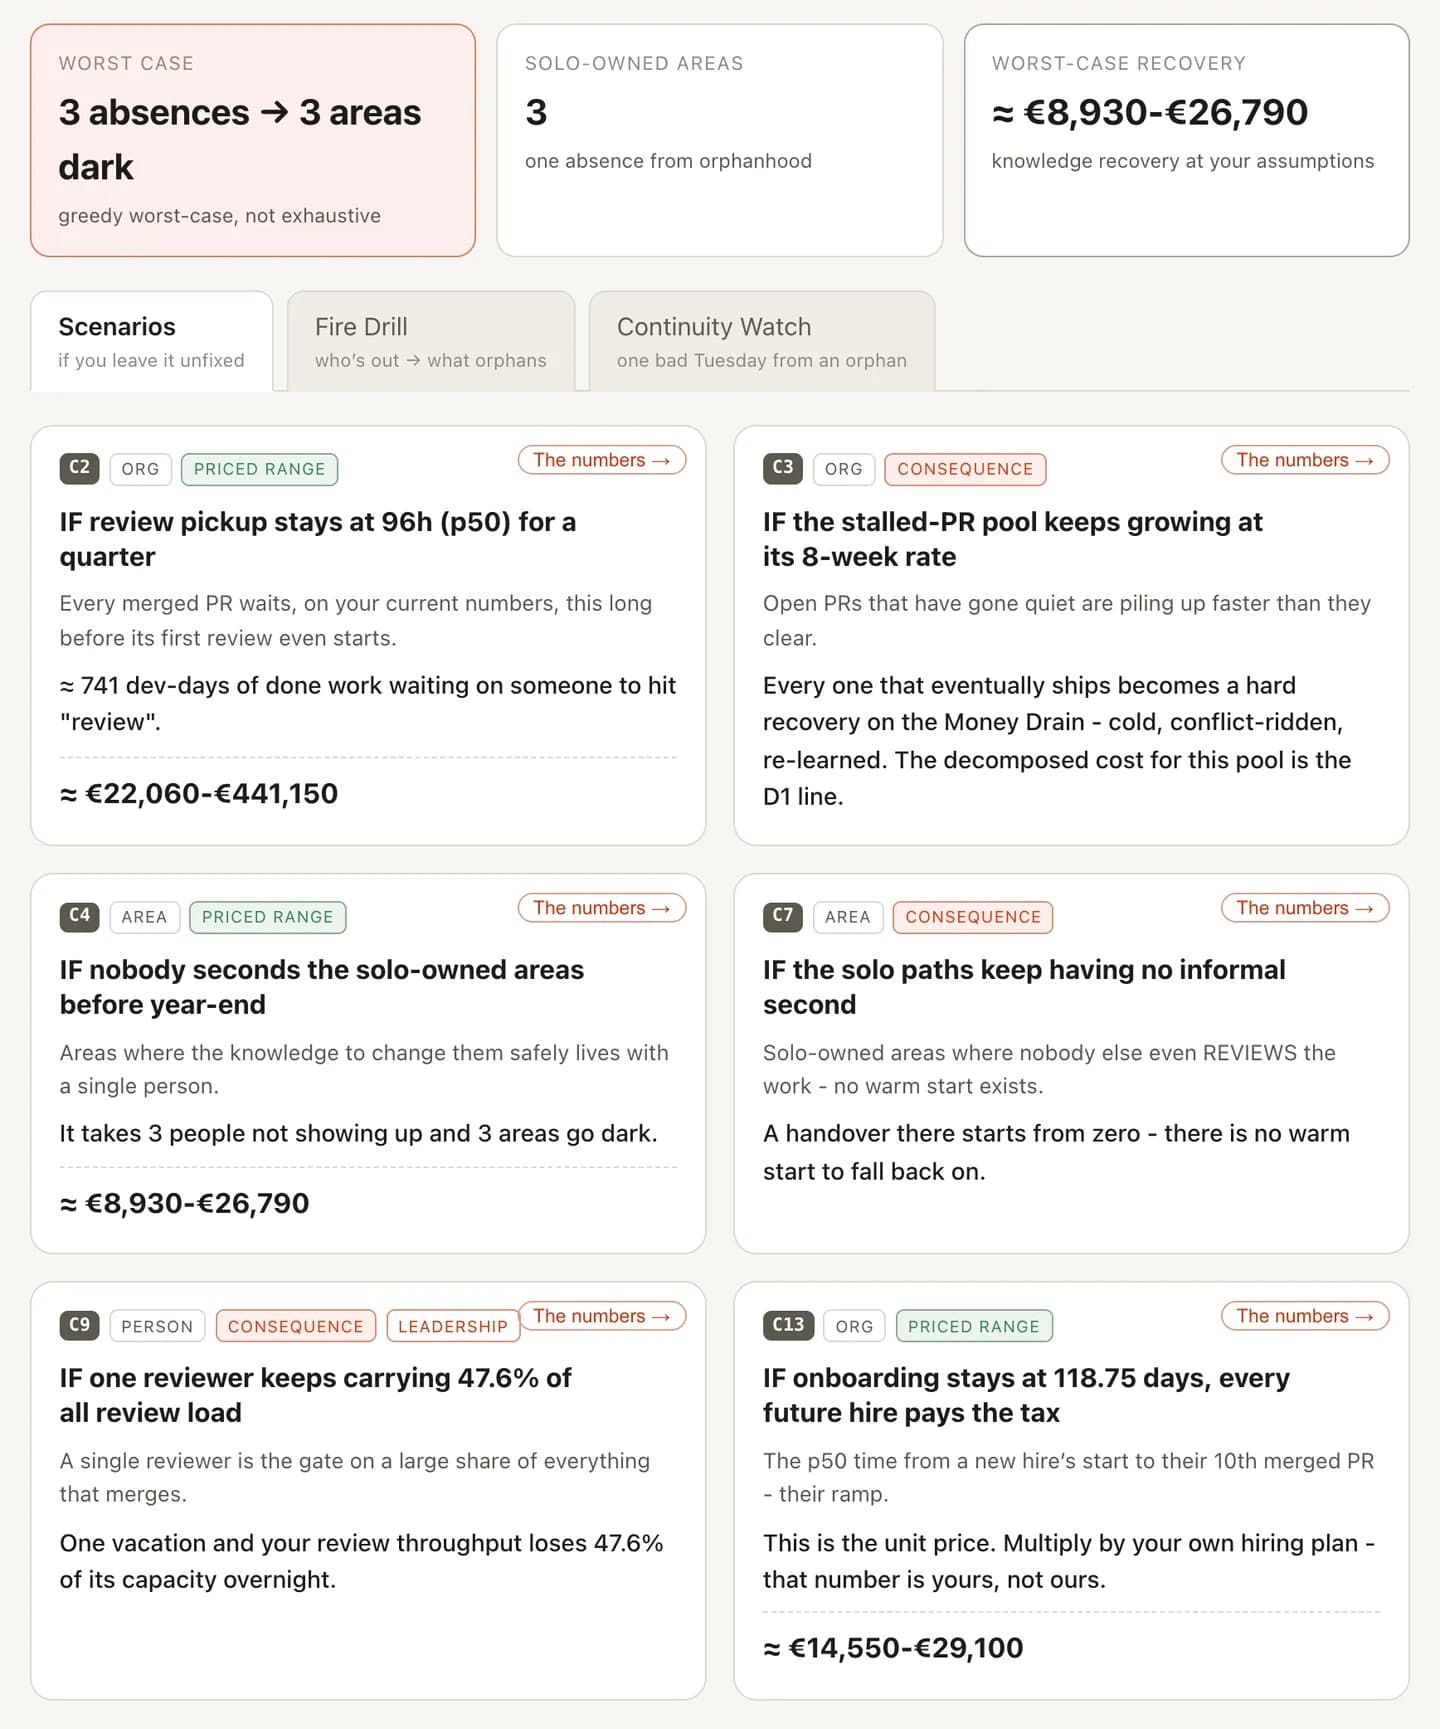
The question with the most money on it: who actually holds each system in their head, and what happens when they leave? The base rates are grim. An analysis of 133 popular GitHub systems found roughly 65 percent had a truck factor of two or fewer, and 34 percent sat at a truck factor of one (Avelino et al., 2016), and a venture-backed target is not exempt from the distribution. Build the map from commit history (the calculation method is public and takes hours, not weeks), then price what you find: every revenue-critical subsystem with one meaningful contributor becomes a retention clause, an escrow line, or a discount. The buyer-side playbook for this specific area is covered in how your acquirer finds your bus factor. Read it from the acquirer's chair.
2. Delivery capability: the DORA keys, from telemetry
Can this org ship, and how do you know? The DORA research program gives you four keys - deployment frequency, lead time, change failure rate, recovery time - that are computable from pipelines and git history without asking anyone anything. In a diligence context the trend matters more than the band: a modest cadence holding steady is a healthier asset than an impressive quarter that coincides with the fundraise. If the target reports framework numbers, ask which framework and which definitions. DORA, SPACE, and DX Core 4 measure genuinely different things, and half of one popular framework's key numbers are perception surveys, which don't survive the re-derivability bar.
3. Review coverage and change control
The wiki will claim a review culture; the merge history will tell the truth. Compute review coverage - the share of merged changes that received a meaningful review - directly from the PR history, and look for the say/do gap: self-merged hotfixes, rubber-stamp approvals minutes after a thousand-line diff, release processes nobody can reconstruct. A contradiction here is worth more than its face value, because it discounts every other claim in the data room.
4. The KTLO and debt load
What share of engineering capacity is spent keeping the lights on versus building what the roadmap promises? The KTLO split is derivable from tracker history, and it's the number that converts directly into post-deal capacity planning. Calibration for skepticism: McKinsey's CIO survey found 10 to 20 percent of technology budget intended for new products gets diverted to resolving tech-debt issues, with accumulated debt estimated at 20 to 40 percent of the value of the entire technology estate (McKinsey). In the Stack Overflow 2024 survey, technical debt was the top frustration, named by 63 percent of professional developers (Stack Overflow). A target that presents its debt as a priced, trending number is showing you competence; a target that can't say is showing you the pessimistic case.
5. Incident health and unplanned work
Incidents are where delivery, ownership, and debt meet reality. Pull the incident history and cross-reference it with the ownership map from area one: the pattern that should raise your eyebrows is the same name resolving every severe incident in one subsystem - that's concentration risk wearing an on-call rotation as a disguise. Then check what unplanned work does to the roadmap math, priced at the fully loaded cost of the engineers absorbing it.
The evidence bar: re-derivable or it doesn't count
Run every number the target hands you through three questions:
- Can my side recompute it? Method disclosed, rows available, result reproducible. If the answer is "it comes from our analytics tool," ask whether that tool's numbers are deterministic or model-generated. Most of the category has models inside load-bearing numbers, which makes them testimony, not evidence.
- Does the history agree? Every process claim gets checked against git and tracker data. The pitch and the repository are two witnesses; when they disagree, the repository is under oath.
- Is the trend shown, or just the snapshot? A single good quarter is a photograph. Diligence prices the movie.
This bar is also the honest answer to "which tools can help": anything from the engineering-intelligence category can accelerate the data pull, but only tools whose numbers re-derive deterministically produce artifacts you can put in a diligence report with your name on it.
What moves the price (and what doesn't)
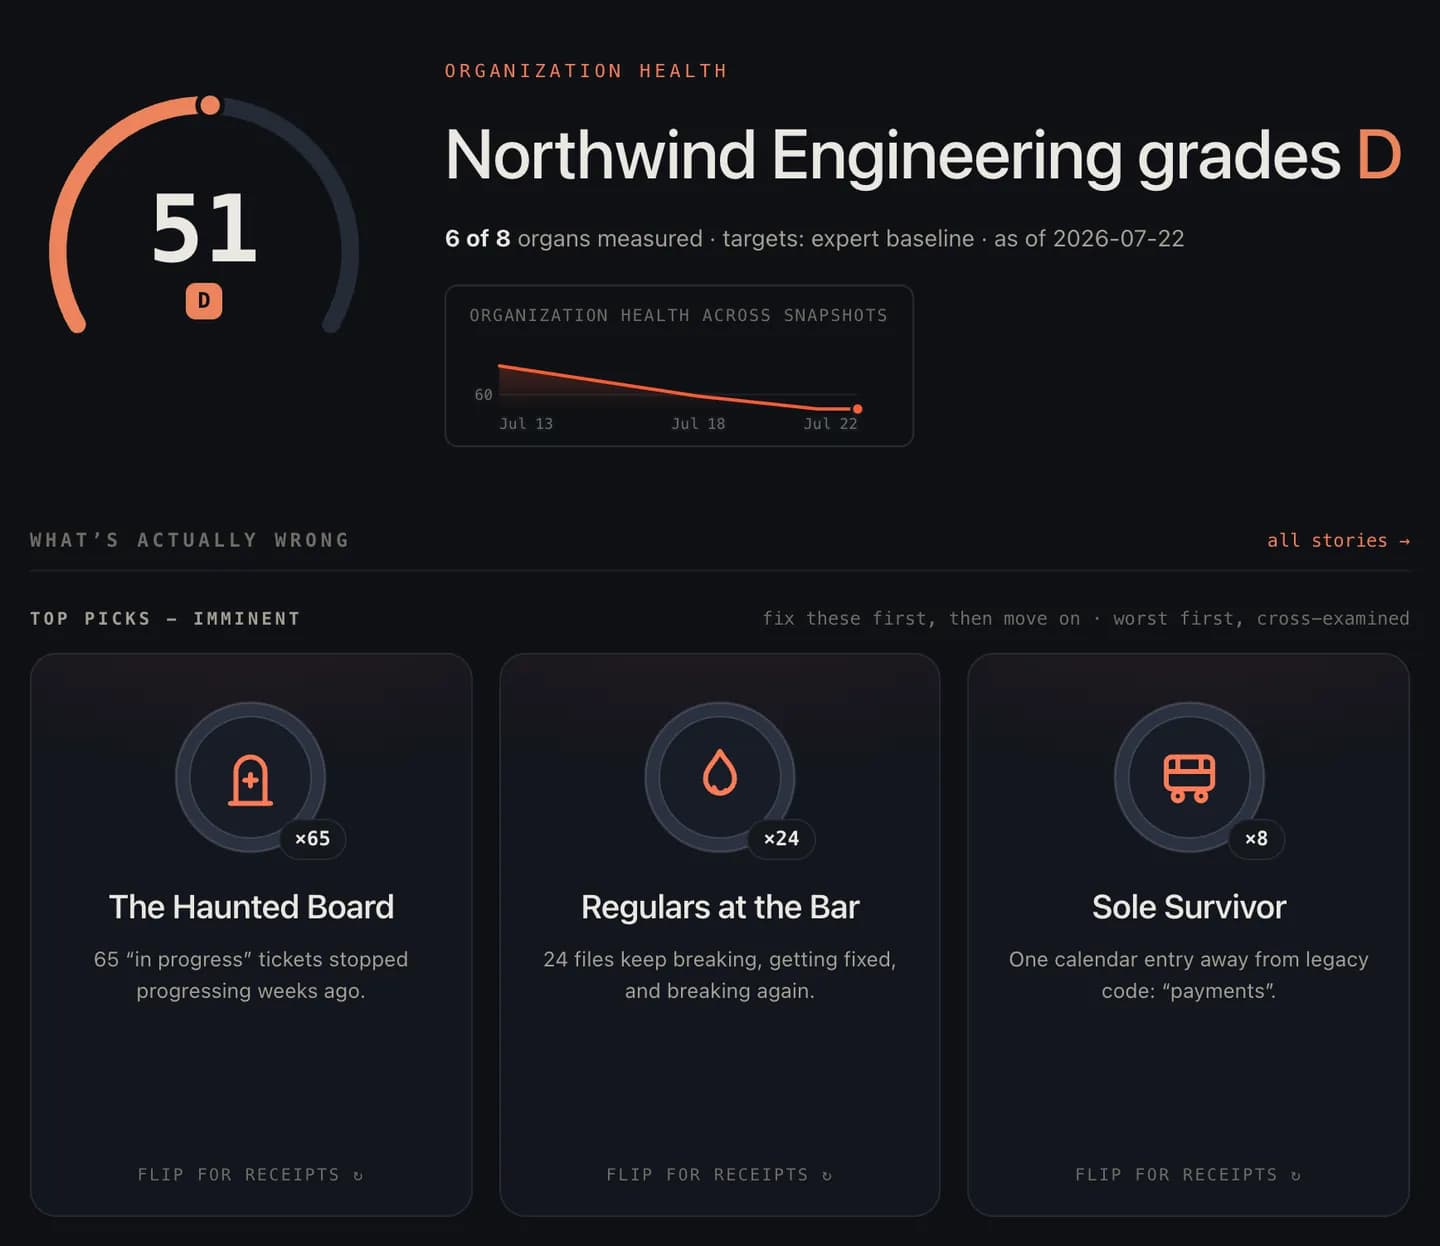
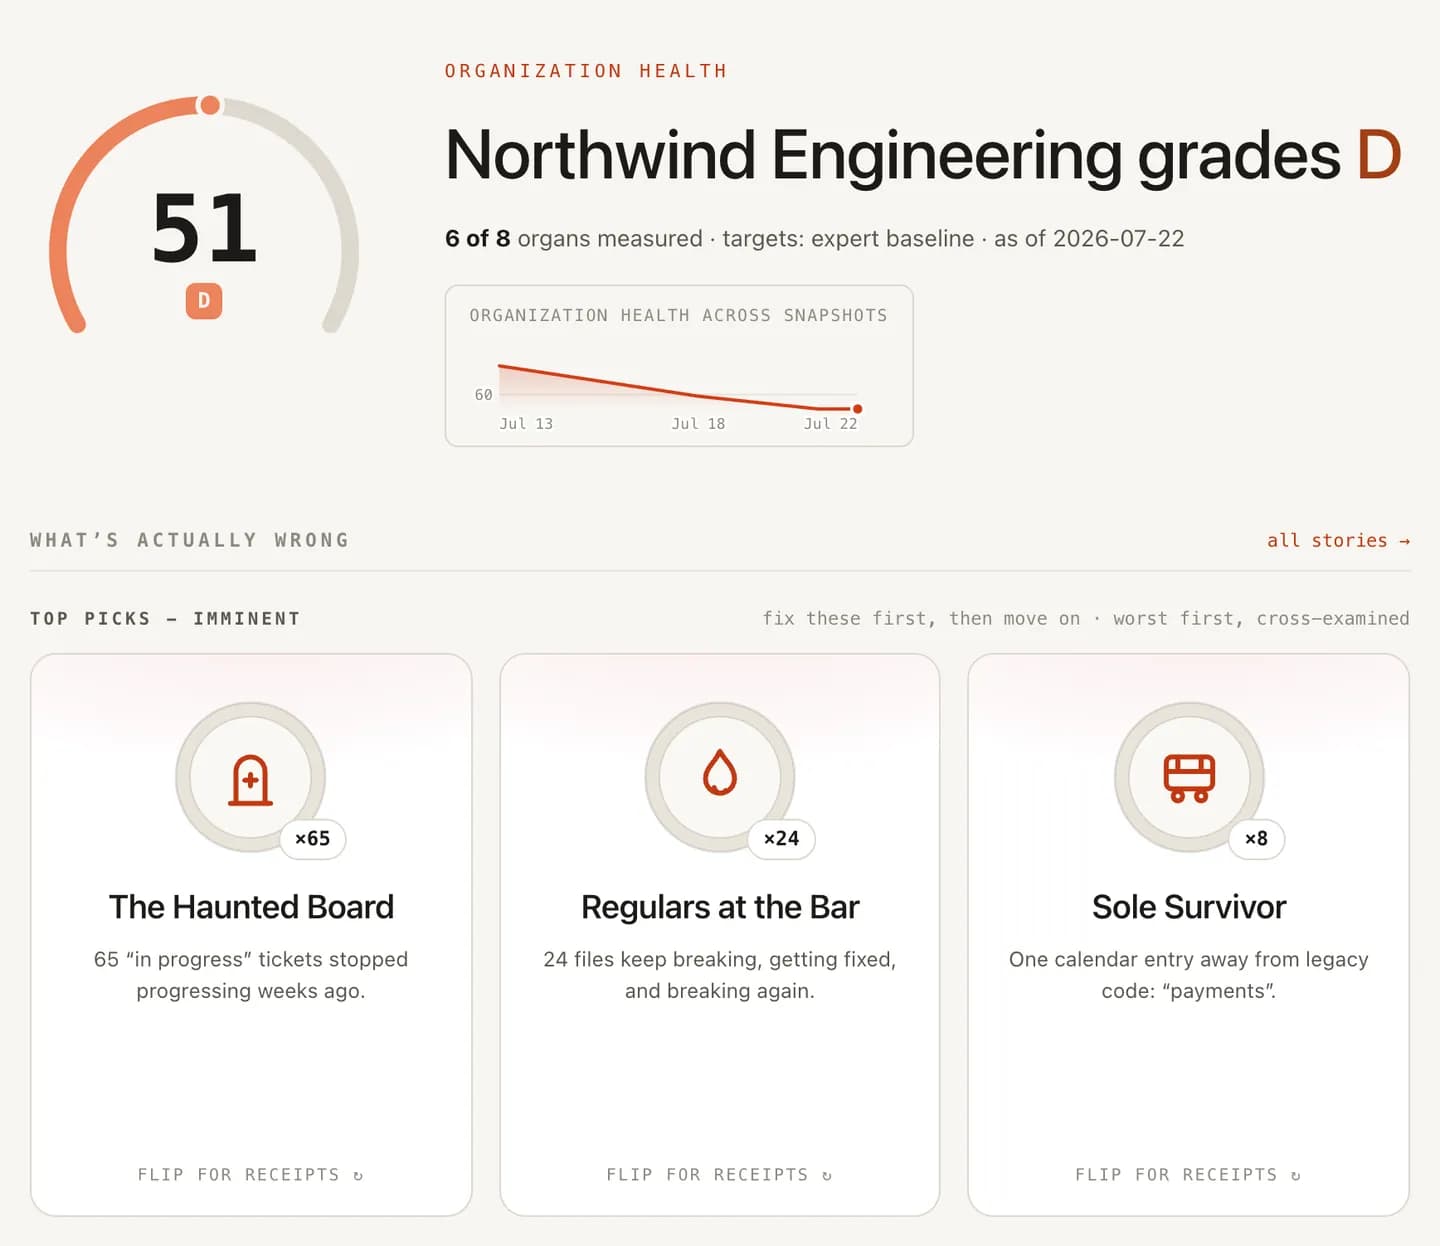
Across the five areas, three finding types dominate deal conversations: the one-person system (area 1, priced via retention and escrow), unpriced debt (area 4, priced pessimistically by the party with least incentive to be generous), and contradiction (area 3, which discounts everything else). Conspicuously absent: the monolith, the framework choices, tabs versus spaces. Structure is context. Risk is price.
The door
If you're the acquirer: run areas one through five in that order, and spend your interview hours where the data contradicts the deck. If you're the incoming CTO: this same checklist is your first-90-days audit, minus the lawyers. And if you're reading this a year before any deal, run it on yourself now, while every finding is still cheap to fix and nobody is pricing it against you. The best diligence outcome is the one where both sides recompute the same numbers and get the same answers.
Frequently asked
What should an acquirer check in technical due diligence?
Five engineering-health areas, in descending order of how often they move the price: knowledge concentration (bus factor per system), delivery capability (the DORA keys pulled from real telemetry), review coverage and change control, the KTLO-versus-new-work split, and incident health. Architecture opinions come after those five, not before - diligence prices risk, and risk lives in concentration, debt, and contradiction more than in framework choices.
How do you verify engineering metrics in a data room?
Insist on re-derivability. For every number in the deck - bus factor, cycle time, review coverage, KTLO share - ask for the method and the underlying rows, then recompute a sample yourself from the git and tracker history. A number that only exists inside a vendor dashboard, produced by an undisclosed model, is testimony; a number you re-derived from the repository is evidence. Diligence runs on the second kind.
How long does the engineering side of due diligence take?
With repository and tracker access, the quantitative core of this checklist - ownership map, delivery baselines, review coverage, KTLO share - is days, not weeks, because it's all derivable from history that already exists. What takes weeks is reconciling claims with data when they disagree. Budget the interview time for the contradictions, not for the numbers.