Engineering Intelligence Tools: The Honest Buyer's Guide
THE HONEST BUYER'S GUIDE
What engineering-intelligence tools actually do, what the category gets wrong, how pricing models work, and how to evaluate one before you spend a euro.
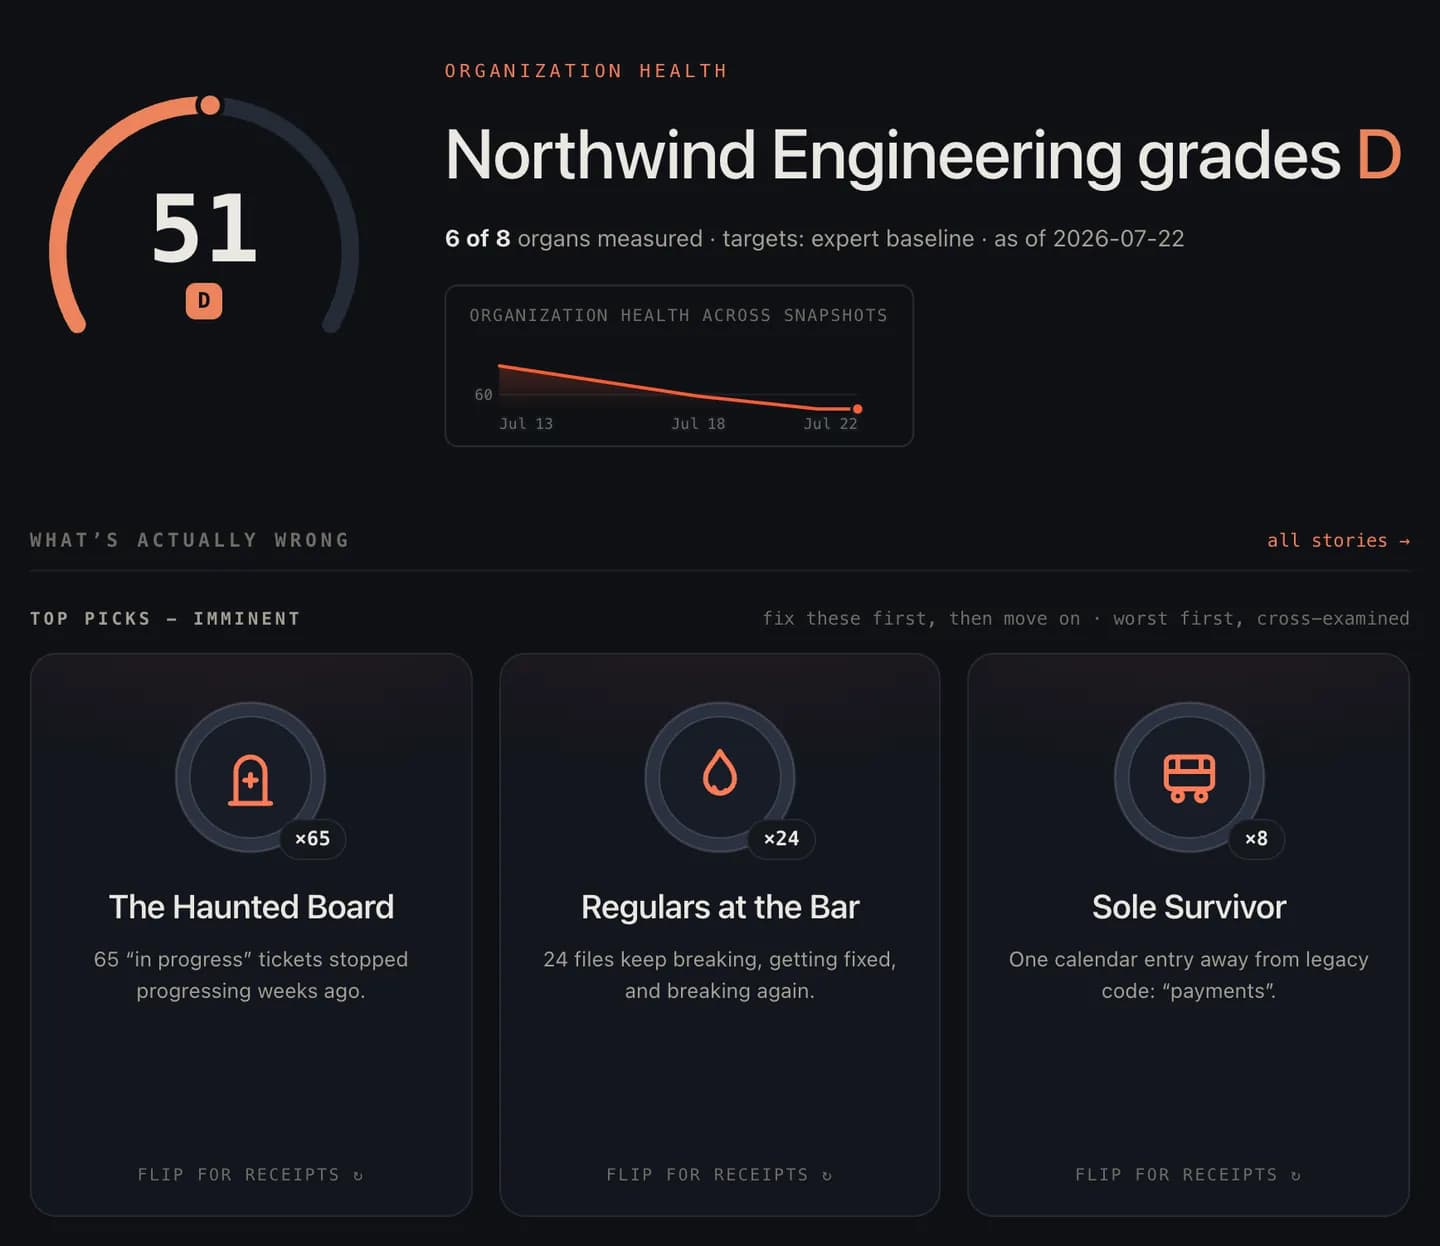
The band we grade against.
Illustrative example
TL;DR: Engineering intelligence tools read the systems you already use - git, tickets, CI, reviews - and turn the exhaust into answers: where delivery stalls, where knowledge is one resignation from vanishing, what AI adoption is actually doing to the code. The category is genuinely useful and genuinely easy to buy badly. This guide covers what the tools do, what they get wrong, how the pricing models differ, and how to evaluate one like an engineer instead of like a procurement checkbox.
Every engineering org above a certain size hits the same wall: the questions get bigger than the anecdotes. How long does a change really take to ship? Who actually understands the payment code? Is the AI spend paying for itself? You can answer these by asking around and collecting five confident, contradictory answers. Or you can answer them from the data your team already produces every day. Engineering intelligence tools exist because the second option beats the first, when the tool is honest about what the data can and cannot say.
This is the buyer's guide we wish existed when the category was forming: vendor-neutral, allergic to dashboard theater, and blunt about when you shouldn't buy anything at all.
What is an engineering intelligence tool?
An engineering intelligence (sometimes "software engineering intelligence" or "engineering analytics") tool connects read-only to the systems where engineering work already happens - your git host, issue tracker, CI pipelines, sometimes chat and incident tooling - and computes metrics, trends, and findings from that activity. The full definition, and how the category differs from plain DORA dashboards, gets its own explainer in what is engineering intelligence.
The one-sentence test: a real engineering intelligence tool tells you something about your org that you didn't already know, and can prove it with links to the actual commits, pull requests, and tickets behind the claim. If it can't show receipts, it's a slideshow.
What engineering intelligence tools actually measure
The capability map, roughly in order of how mature the measurement is:
- Delivery and flow. Cycle time, lead time, deployment frequency, and the queues in between: the territory mapped by a decade of DORA research. This is the most standardized lane in the category; our delivery-metrics guide covers what the numbers mean and how they lie. Deciding which measurement framework to standardize on (DORA, SPACE, or DX's Core 4) has its own side-by-side comparison.
- Code review dynamics. Pickup time, review load distribution, stuck PRs, rubber-stamp detection. Review queues are where most orgs' cycle time actually goes to die.
- Knowledge and ownership risk. Who really knows each area of the codebase, and what breaks when someone leaves: the bus factor family of analysis. This lane matters more than most buyers realize going in. In the 2024 Stack Overflow survey, 45.2% of professional developers said knowledge silos prevent them from getting ideas across the organization, and 61% reported spending more than 30 minutes a day just searching for answers. It's the same concentration a technical due-diligence checklist exists to surface before an acquisition, when a single-owner system stops being a nuisance and starts being a deal risk.
- AI impact. How much of the codebase is AI-assisted, and what that's doing to churn, duplication, and quality. The newest lane, and the one with the widest gap between vendor claims and honest measurement.
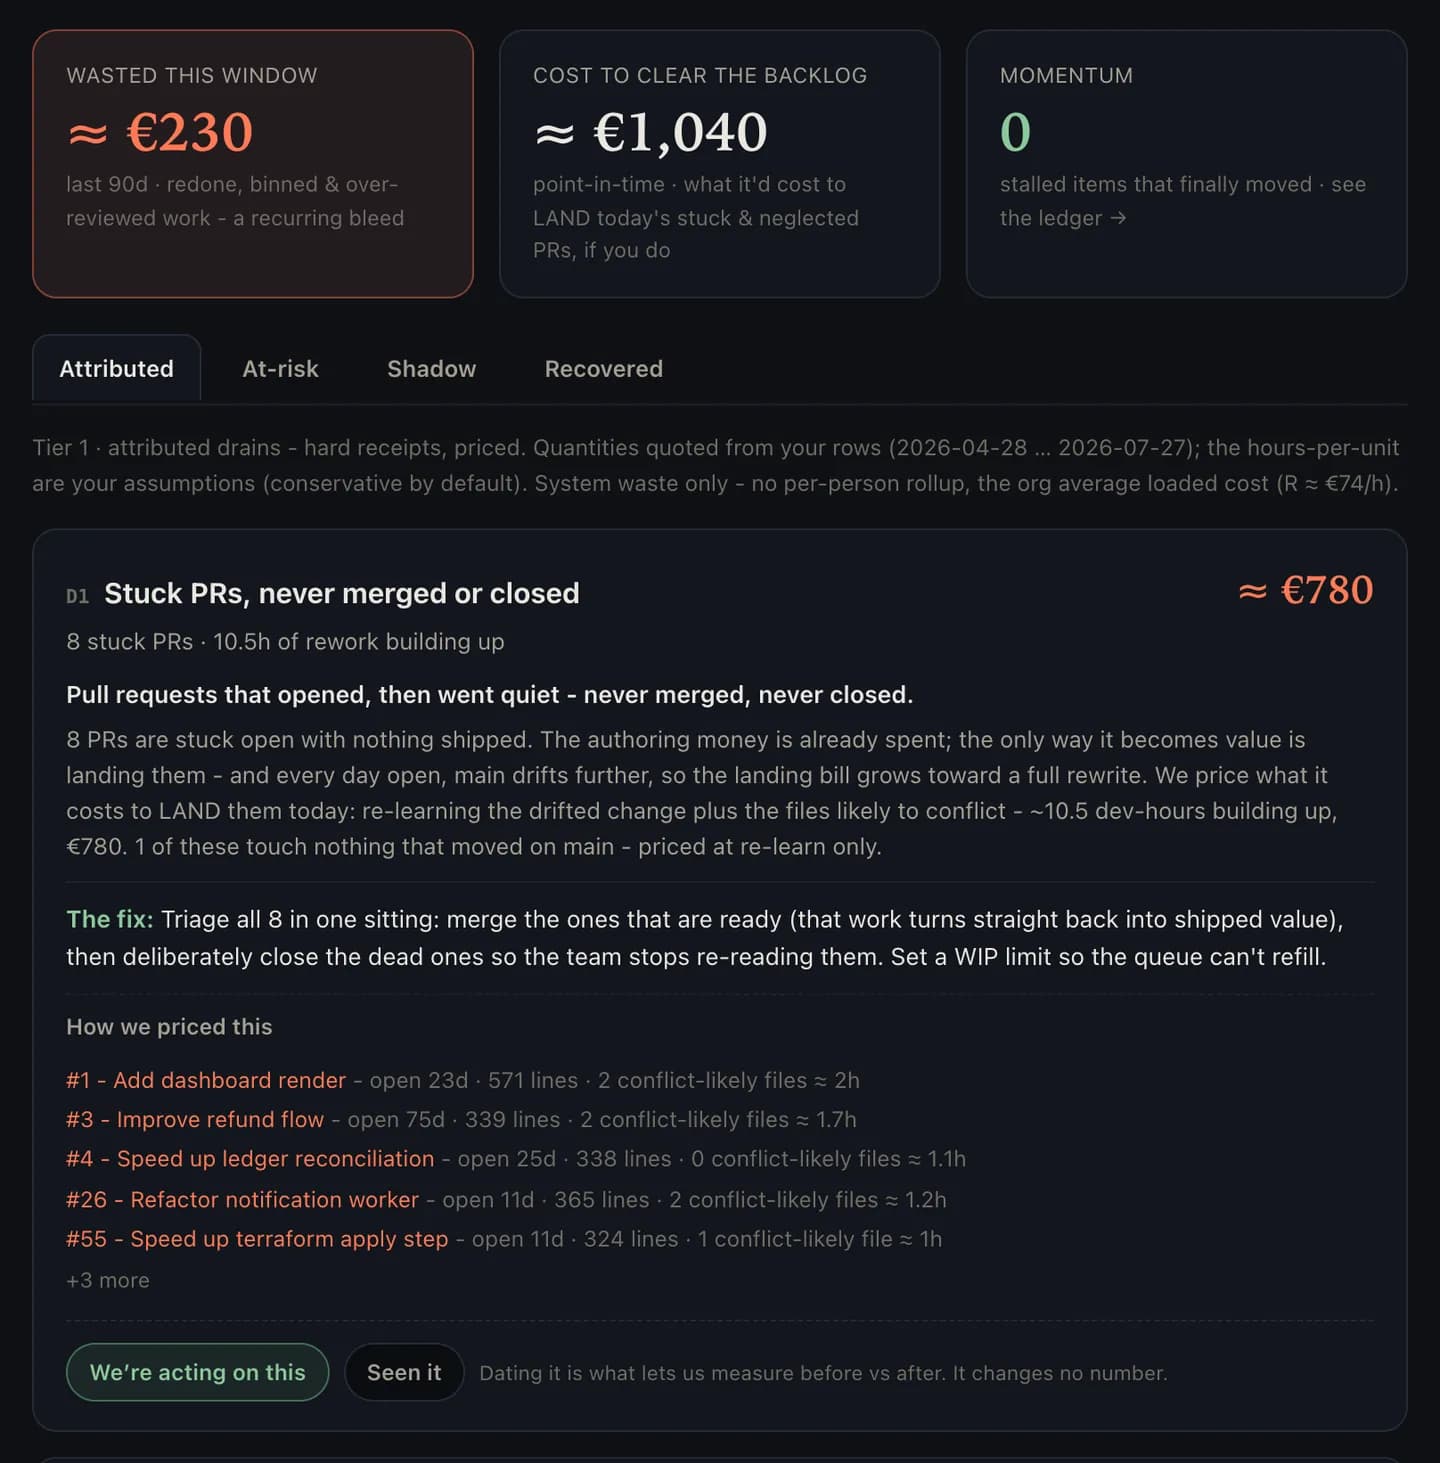
- Engineering economics, meaning all of the above translated into money: what slow reviews cost in payroll, where investment actually goes, what a key departure would cost.
No single tool is elite at all five. Part of evaluation is knowing which lanes your org actually needs answered first.
What the category gets wrong
Buying well requires knowing where these tools embarrass themselves, because the failure modes are consistent across the category:
Individual productivity scores. Some tools will rank your developers by a composite number. The researchers behind the SPACE framework are unambiguous: productivity "cannot be measured by a single metric or dimension," and any honest metric set spans multiple dimensions with at least one perceptual measure. A tool that stack-ranks humans by commit activity is not measuring productivity - it's automating a bias and calling it data. The case against individual metrics is worth reading before any vendor demo.
Single-number theater. A composite "engineering health score" with no drill-down is astrology with an API. Every number on the screen should decompose into the real PRs, commits, and tickets that produced it.
Surveillance creep. A tool your engineers experience as monitoring will be gamed within a quarter, and the data will rot accordingly. Measurement has to point at the system (queues, processes, structures), never at individuals' keystrokes. The team-health guide covers how to measure without becoming the org's most-hated dashboard.
Metrics without prescriptions. Knowing your cycle time is high is worth little. Knowing which stage, which repos, which structural cause, and what to do Monday is the actual product. A wall of charts that ends without a recommendation is homework.
How engineering intelligence pricing works
No prices here, because they change and this guide doesn't. The models are stable and worth understanding, because the model shapes the vendor's incentives:
- Per-seat. You pay per developer (definitions of "developer" vary wildly: committer? licensed user? anyone in the git history?). Cost scales with headcount whether or not value does, and growing teams get a built-in price escalator.
- Flat tiers. A fixed price per band of org size. Predictable, budget-friendly, and the vendor's incentive is to keep the whole org happy rather than to maximize seat count.
- Usage and module add-ons. A base platform plus paid modules or data-volume charges. Watch for the version where every question you actually care about lives in a module you haven't bought yet.
Whatever the model, ask the same three questions: what exactly is the unit I'm paying for, what happens to the price when my team doubles, and what do I keep if I leave? The full list lives in questions to ask before buying engineering analytics.
How to evaluate a tool before you buy
Short version here; the complete evaluation checklist has the long one.
- Receipts. Every metric drills down to real PRs, commits, and tickets. No exceptions.
- Definitions. The tool documents exactly how each metric is computed, and the numbers are reproducible - same data in, same numbers out. More of the category fails this test than the marketing suggests: we read every major vendor's methodology docs against it in the determinism audit, receipts included.
- People posture. System metrics only, with stack ranks refused. Ask directly what the tool declines to build; the answer tells you more than the feature list.
- Time to first honest insight. Connect read-only, and within a day the tool should tell you something true and slightly uncomfortable. If the first week is configuration ceremonies, the second month will be too.
- Exit cost. Data export, contract terms, and what institutional knowledge evaporates if you cancel.
Full disclosure: we build one of these tools, which is why this guide stays vendor-neutral. If you want the named head-to-heads, we've written honest, cited comparisons against LinearB, Swarmia, Jellyfish, DX, Faros AI, GitClear, Multitudes, Harness SEI, Waydev, Typo, Allstacks, Code Climate, Hatica, Oobeya, and Navigara, concessions included. If your shortlist is really an adjacent category (an internal developer portal or PR-workflow tooling rather than a rival), the category-line pieces on Cortex, Port, Graphite, and Aviator draw the boundary honestly, "many orgs want both" verdicts included. And when the shortlist doesn't include us at all, we've refereed the matchups buyers actually search: LinearB vs Swarmia, LinearB vs Jellyfish, LinearB vs DX, LinearB vs Faros AI, GitClear vs LinearB, Swarmia vs Jellyfish, DX vs Swarmia, and Jellyfish vs DX. All of them hold to the same receipts standard, with Busfactor confined to a clearly-labeled third-option section. And when you're shopping to replace a specific incumbent, the honest shortlists for LinearB alternatives and Jellyfish alternatives map the whole field around each, Busfactor included and clearly marked. Read them after the checklist, not instead of it.
Build vs buy: the DIY question
Every engineering org considering this category contains at least one engineer who is certain they could build it in a weekend. Sometimes they're right. The honest arithmetic of when, including the edge cases that eat the second and third weekend, gets a full treatment in build your own metrics dashboard vs buying one. The compressed answer: build when you have one question and spare capacity; buy when you have recurring questions and a payroll that makes engineer-hours your most expensive currency.
Who needs what, at which size
- Under ~10 engineers, you probably don't need a platform yet. You need one or two metrics pulled honestly (start with the delivery basics) and a culture of looking at them. Buy when the answers stop fitting in one conversation.
- ~10-50 engineers. The sweet spot for the category. This is where queues form, silos calcify quietly, and the CTO stops having read every PR. A tool that measures delivery, review flow, and knowledge risk pays for itself the first time it flags a single-owner system before the owner resigns.
- 50+ engineers. You need the platform and the operating discipline around it: metric definitions everyone accepts, review rituals that consume the data, and hard guardrails against the individual-ranking failure mode. At this size, a bad dashboard doesn't just mislead, it sets policy.
The bottom line
Engineering intelligence is a real category solving a real problem: your org's most important questions are already answered in its own data, and almost nobody is reading it. Buy the tool that shows receipts, refuses to rank humans, prices predictably, and tells you something uncomfortable in week one. Skip the one with the composite score and the leaderboard - your team will smell it before you do, and they'll be right.
Frequently asked
What is an engineering intelligence tool?
A platform that connects to the systems your engineering org already runs on - git hosting, issue tracker, CI, chat - and turns their raw activity into decision-grade signal: where delivery is slow, where knowledge is concentrated, what AI is doing to the codebase, and what it all costs. The honest ones show the receipts behind every number; the dishonest ones show you a single score and ask you to trust it.
How much do engineering intelligence tools cost?
Pricing follows a few recurring models rather than one going rate: per-seat (price scales with headcount), flat tiers (a fixed monthly price per band of org size), and usage- or module-based add-ons. The model matters more than the sticker: per-seat pricing grows with your team whether or not the value does, and seat definitions vary - always ask exactly who counts as a seat.
Does a small engineering team need an engineering intelligence platform?
Below roughly ten engineers you can get surprisingly far with your git host's built-in views and honest conversation - the team still fits in one room. The case for tooling strengthens when nobody can answer basic questions from data anymore: how long changes really take to ship, who is the only person who knows the billing code, whether review load is concentrating on one poor soul.
Will these tools measure individual developer performance?
Some try, and that's where the category embarrasses itself. The researchers behind the SPACE framework are explicit that productivity cannot be measured by a single metric, and ranking individuals by activity counts rewards volume, not value. A well-designed tool measures the system - queues, silos, friction - and treats people data as coaching context, never as a leaderboard.